
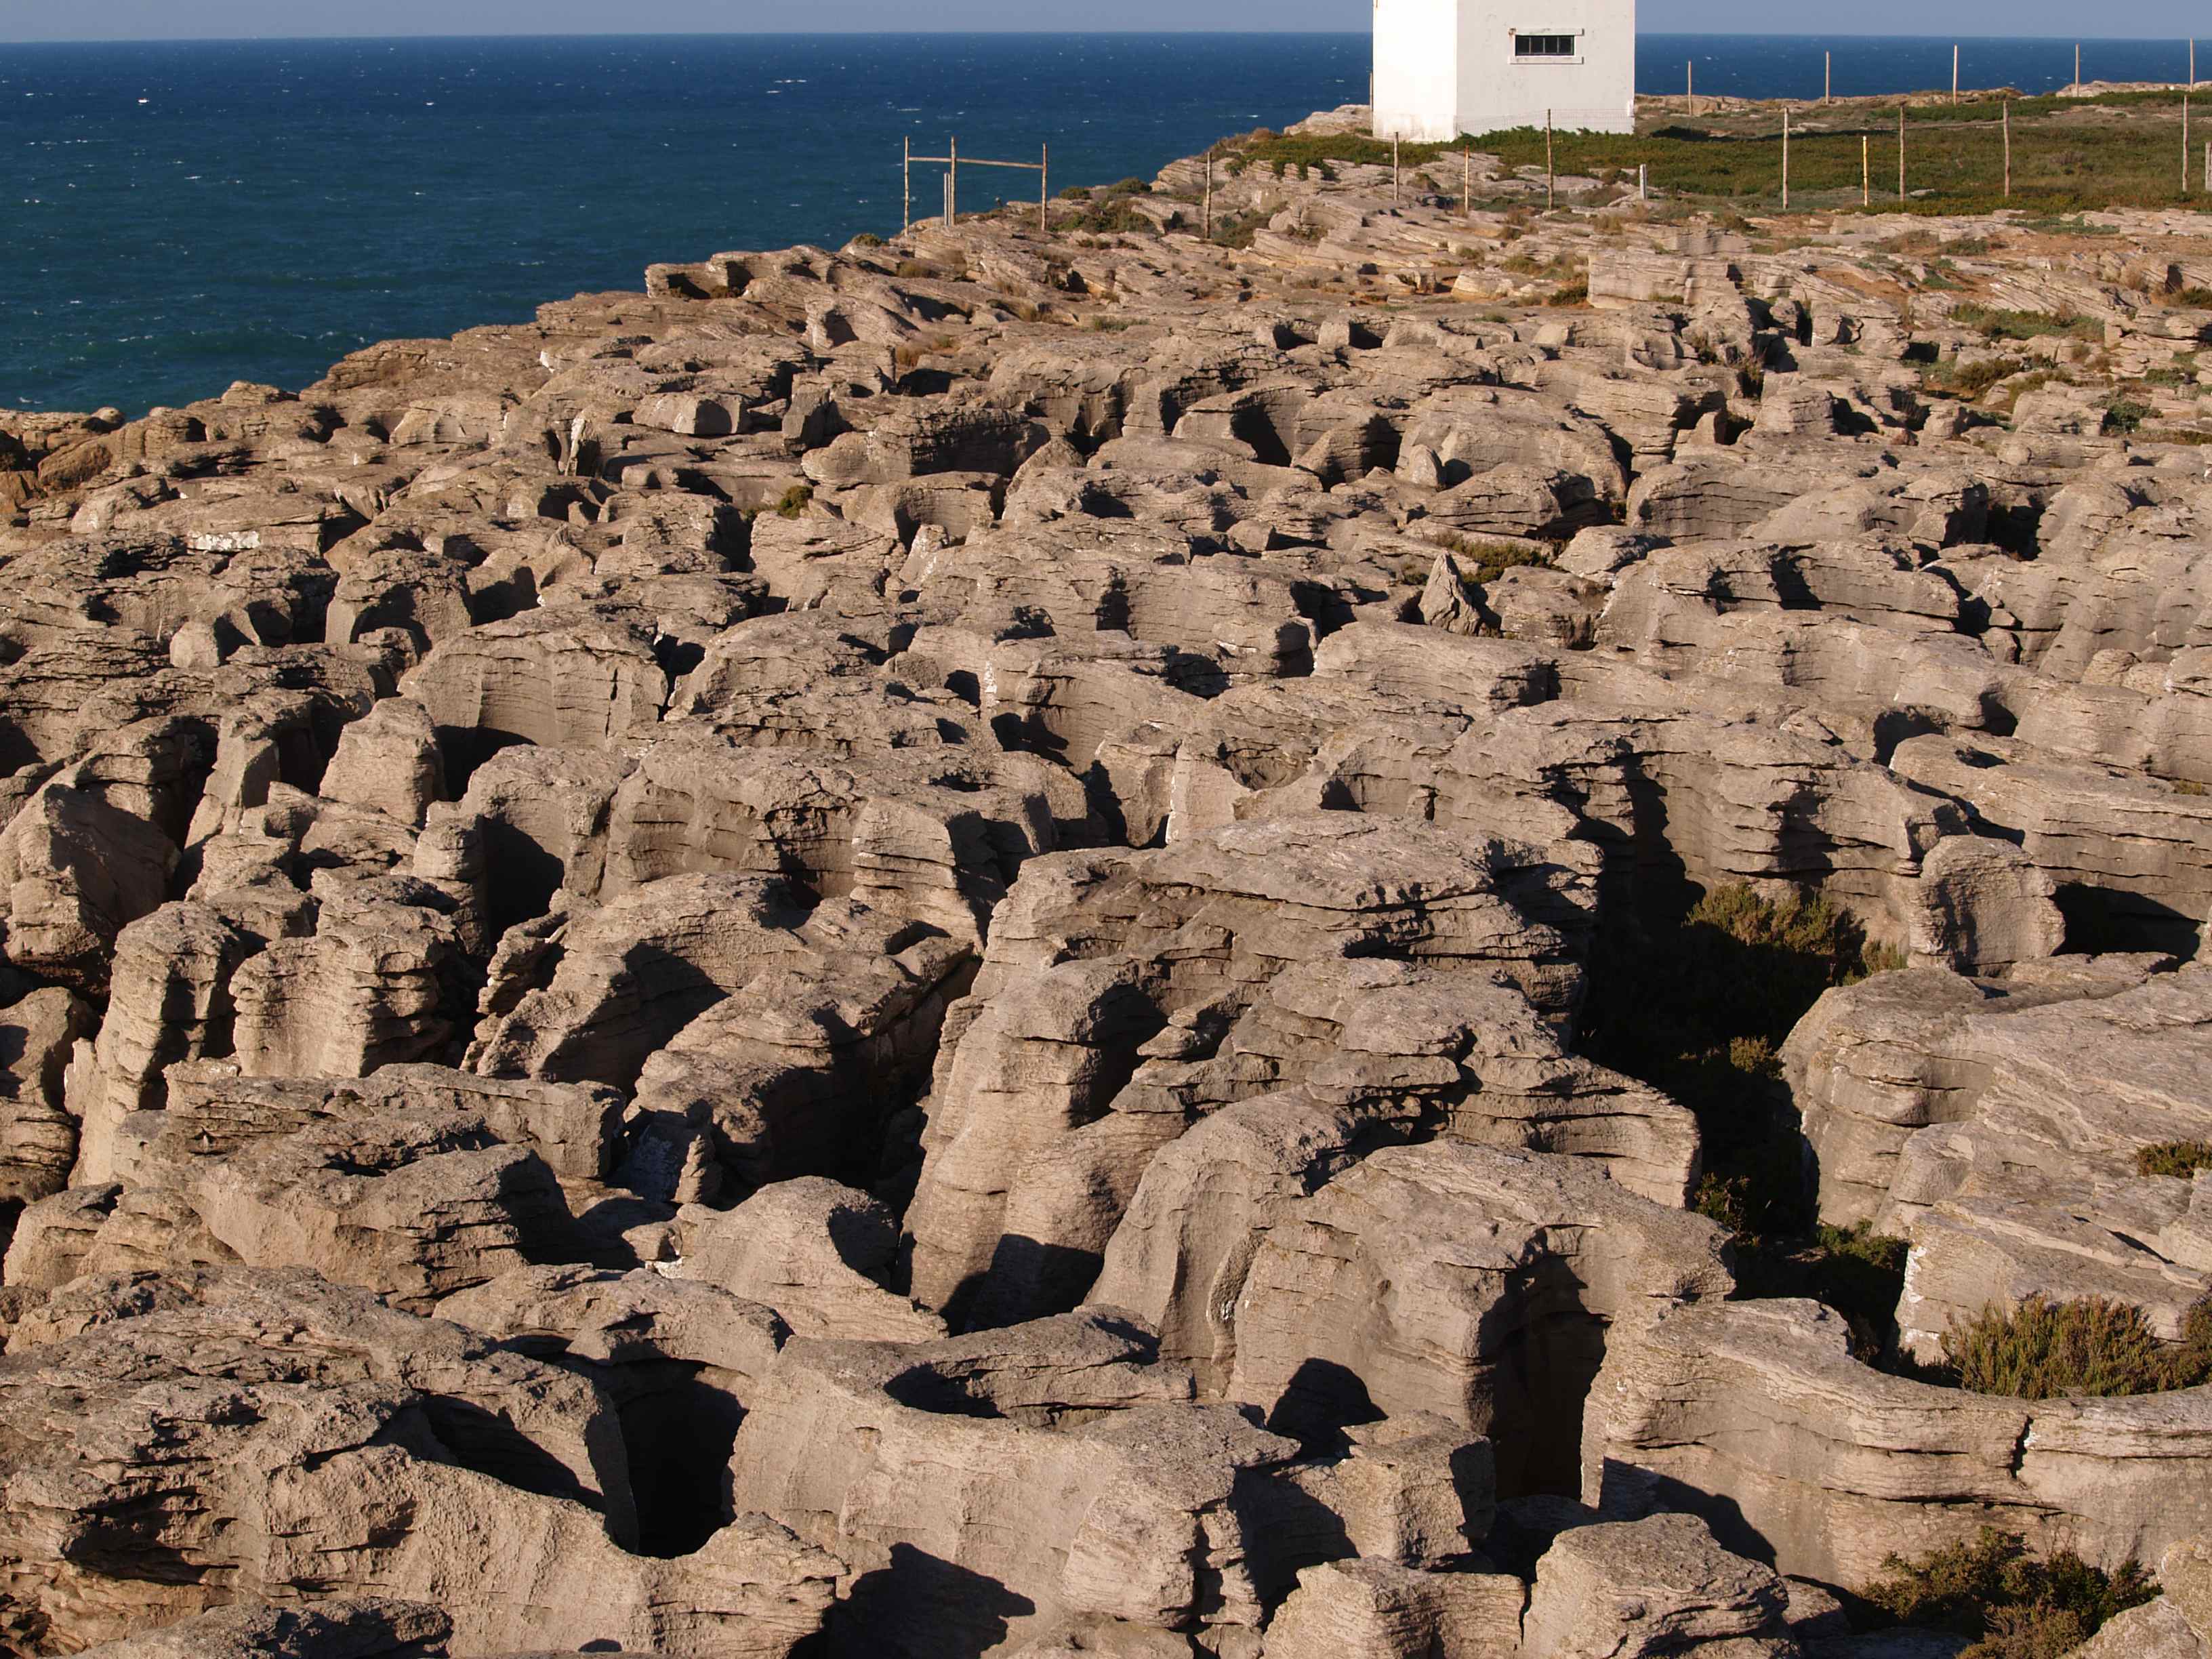
9.1 PRIMITIVE EXTRACTION
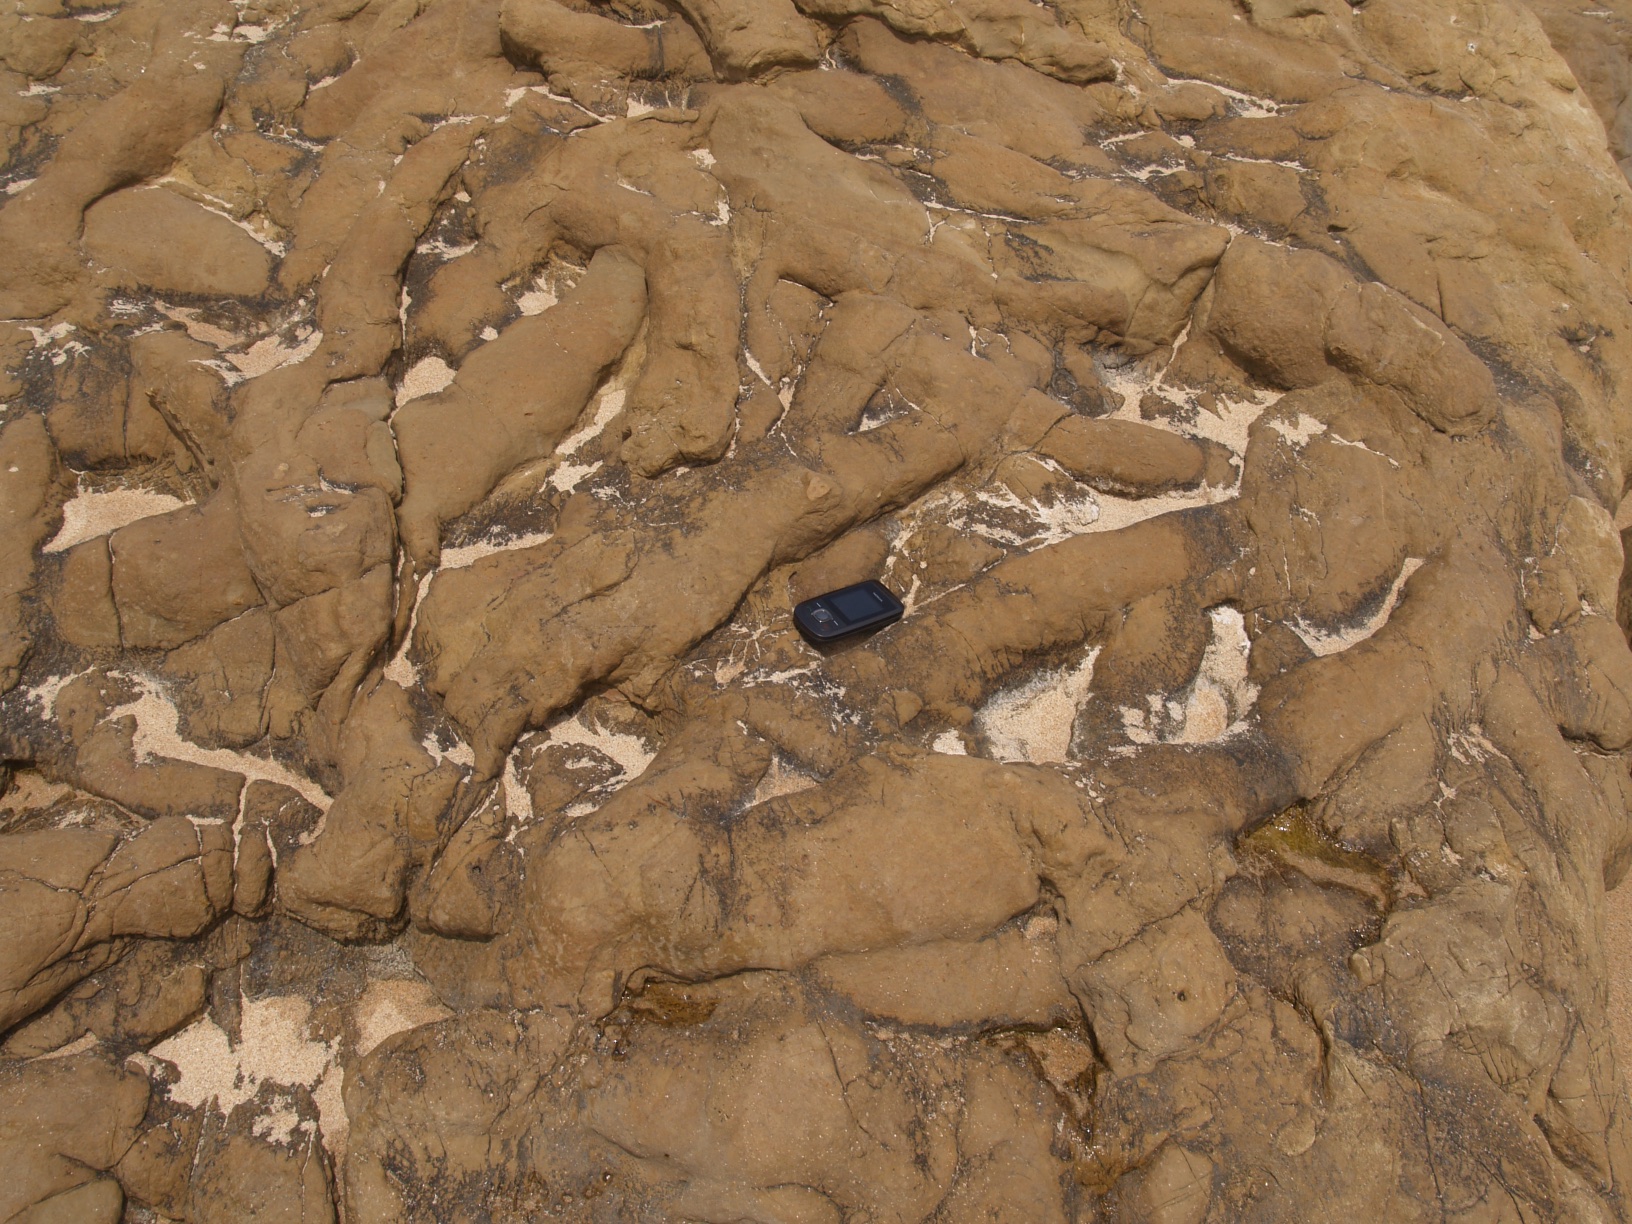
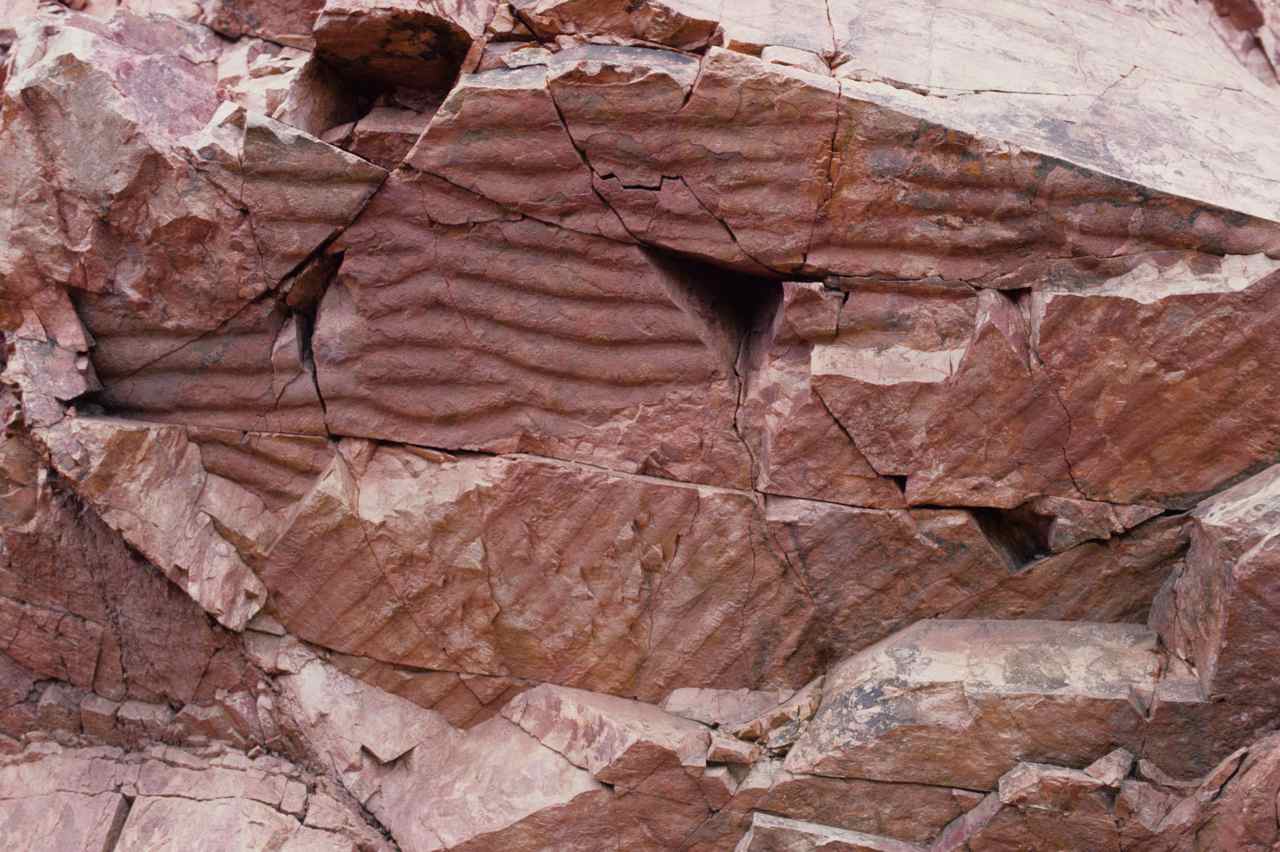
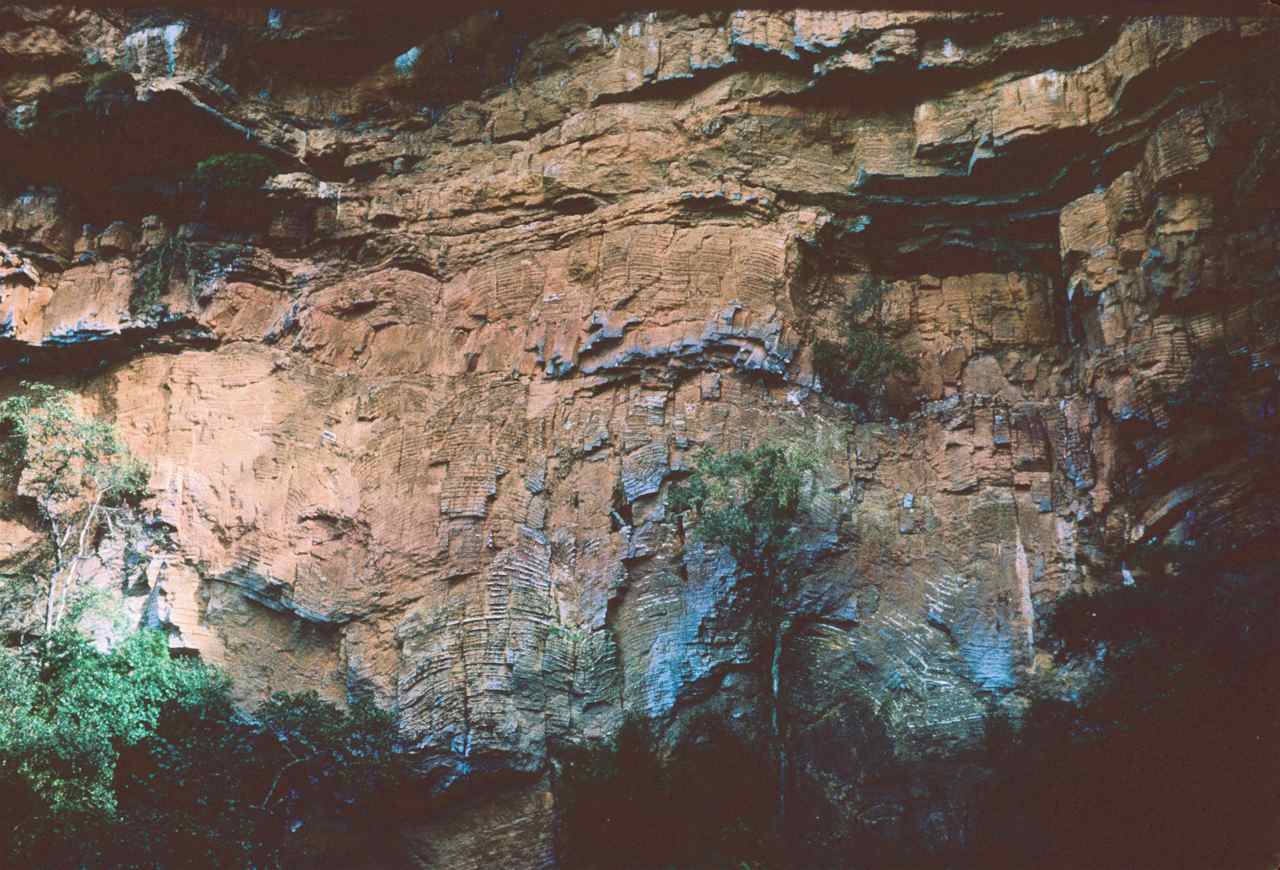
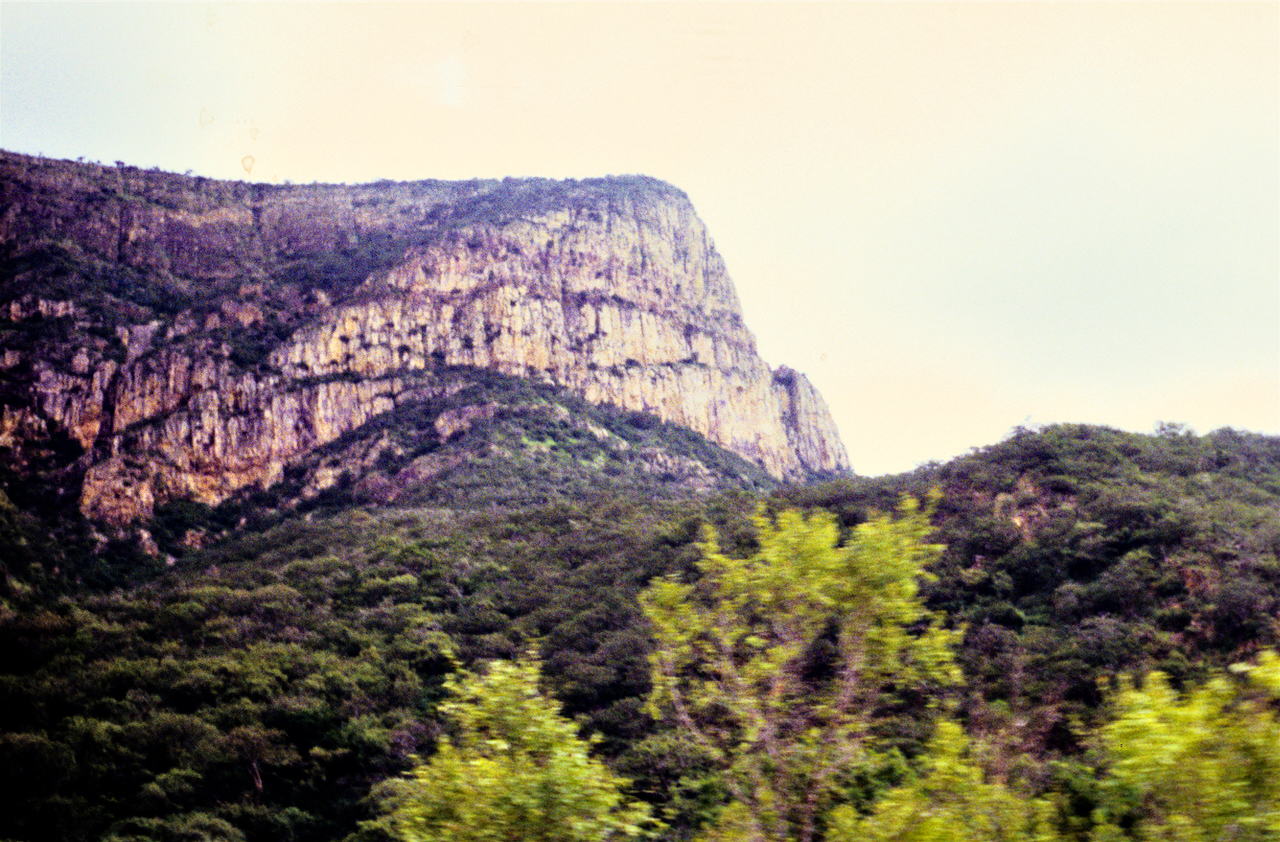
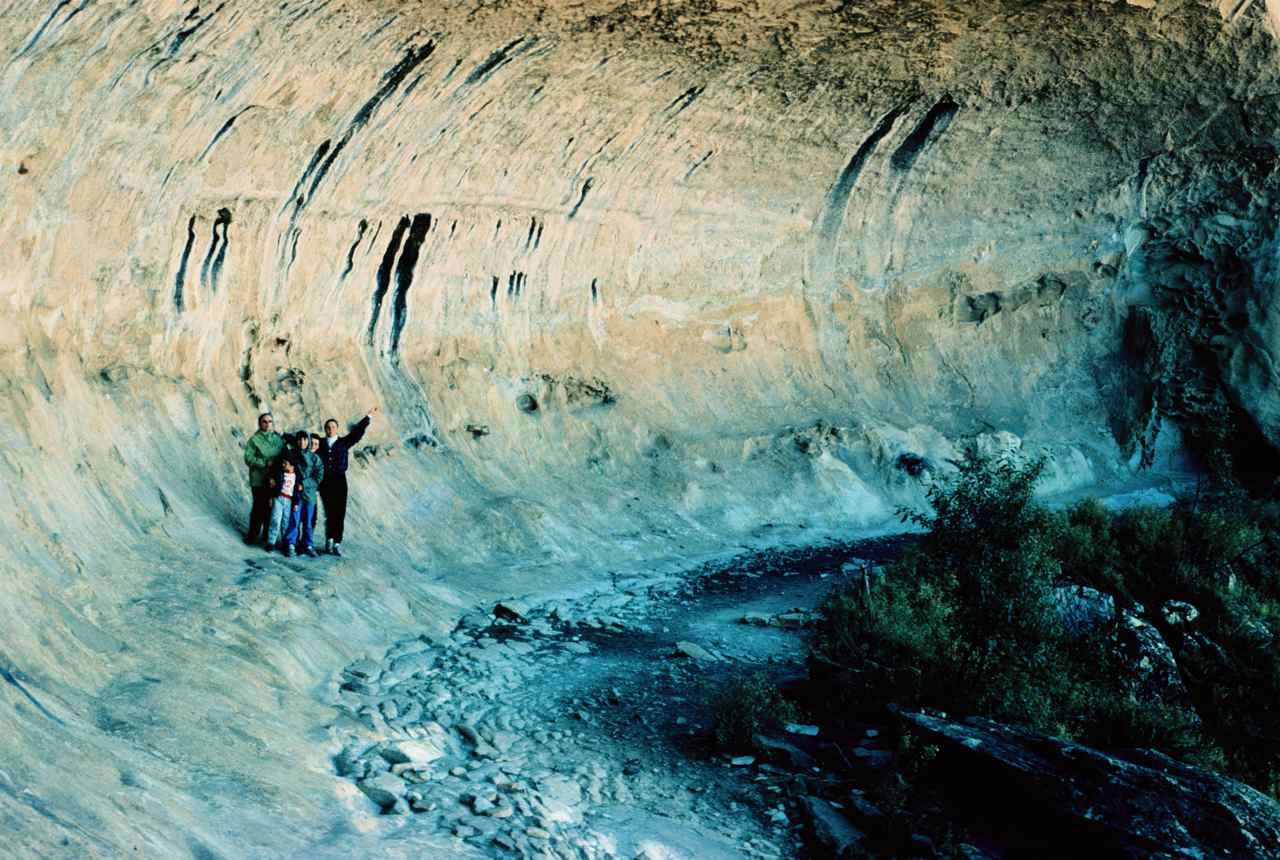
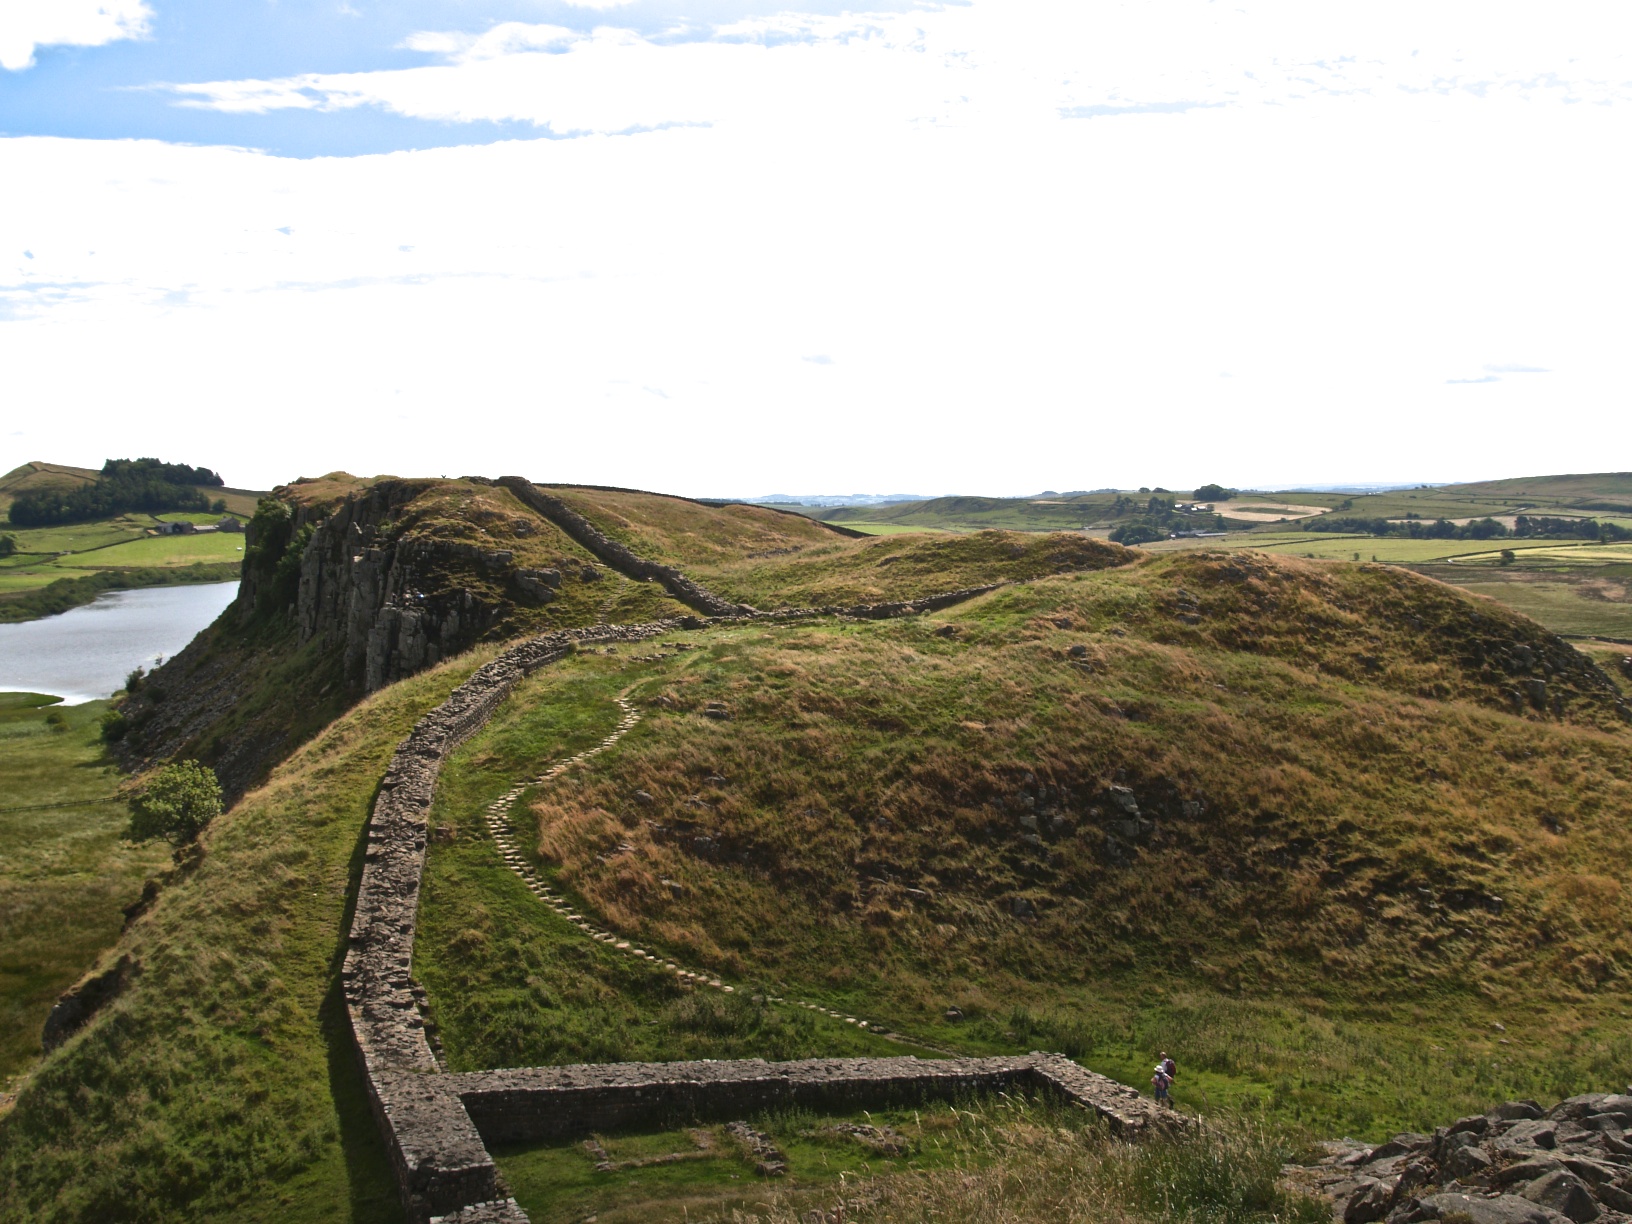
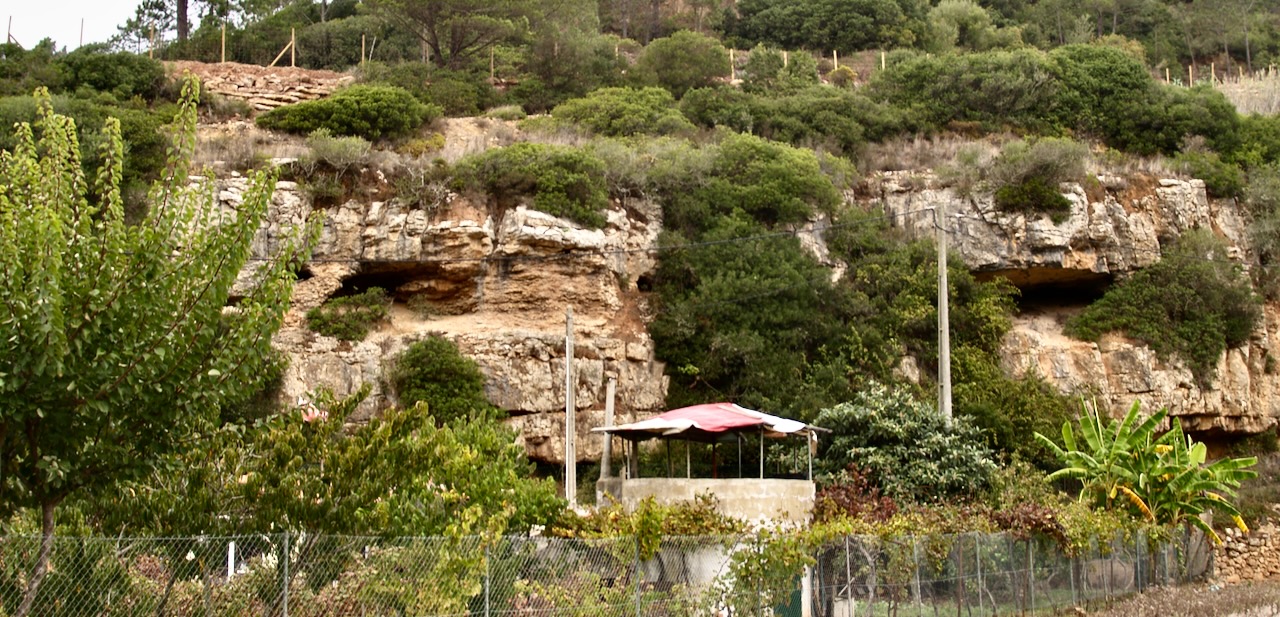
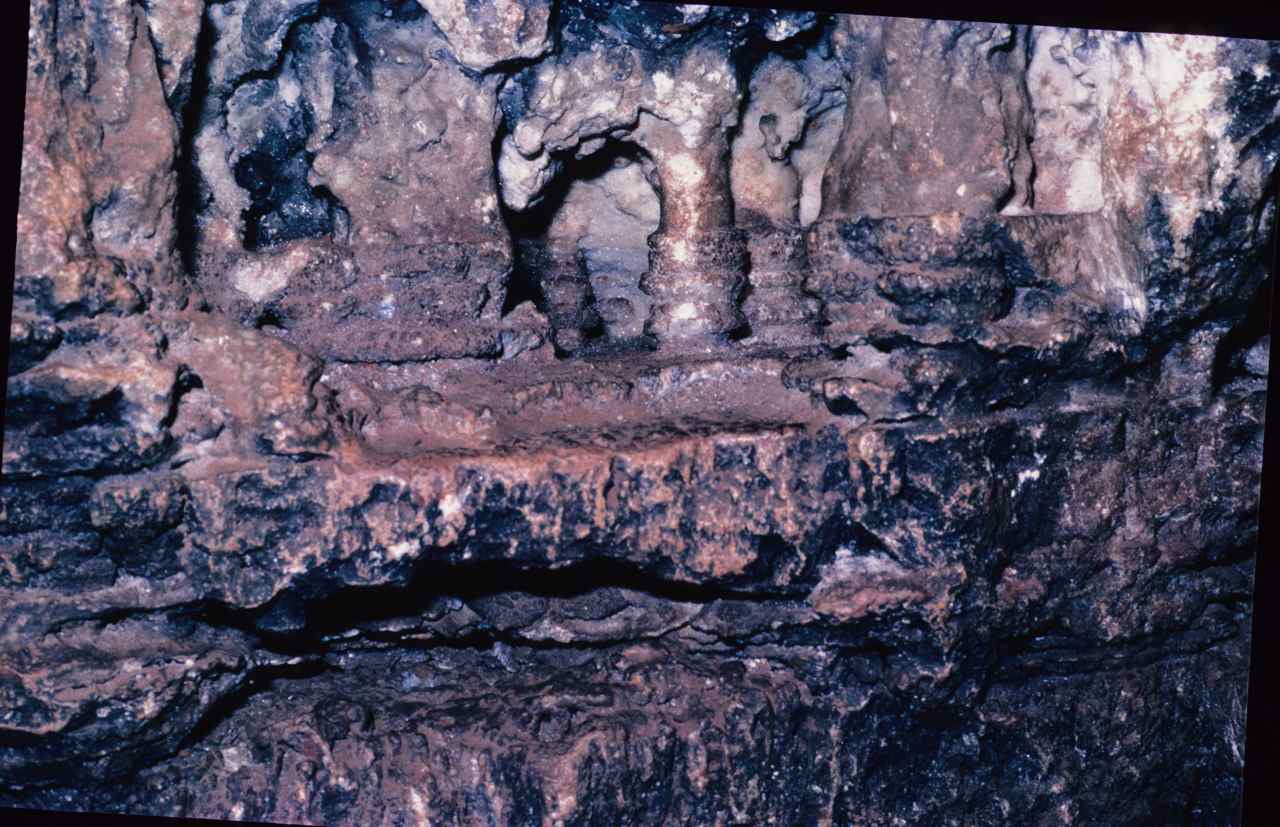
I include under mining all human activities concerned with the extraction of inert natural materials. As such, the extraction of stone for construction, is mining, and at the beginning, perhaps the easiest was the excavation in relatively soft sandstones, to enlarge the original caves where the people dwelt (fig. 89). Also, rock blocks shaped by natural jointing were used originally possibly only for religious purposes (fig. 163B),

Figure 163B – Stonehenge, one of the earliest human utilisation of stone.
but later they started building wall protections and houses by “dry packing” carefully selected well shaped blocks (fig. 163C).
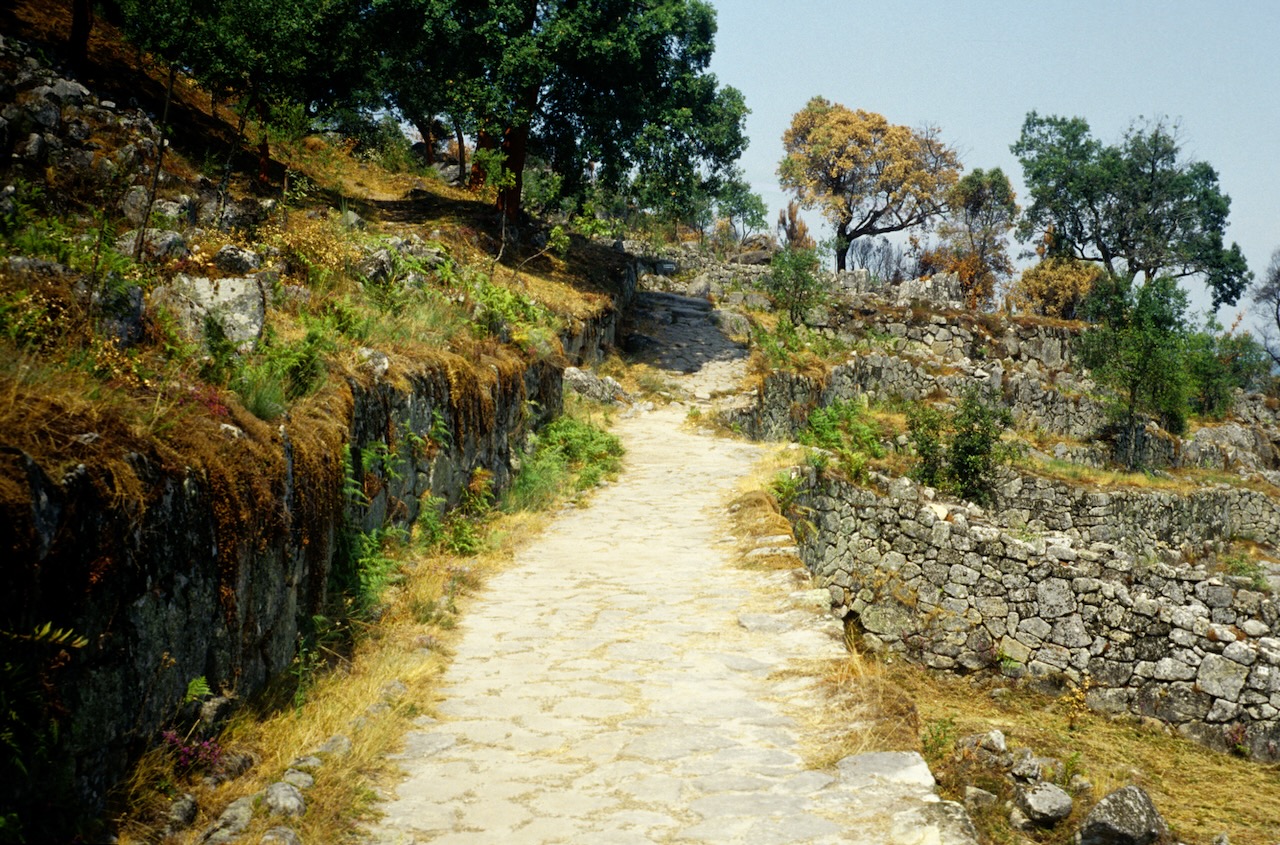
Figure 163C – The remains of a Bronze Age village (Citânia de Briteiros, Portugal).
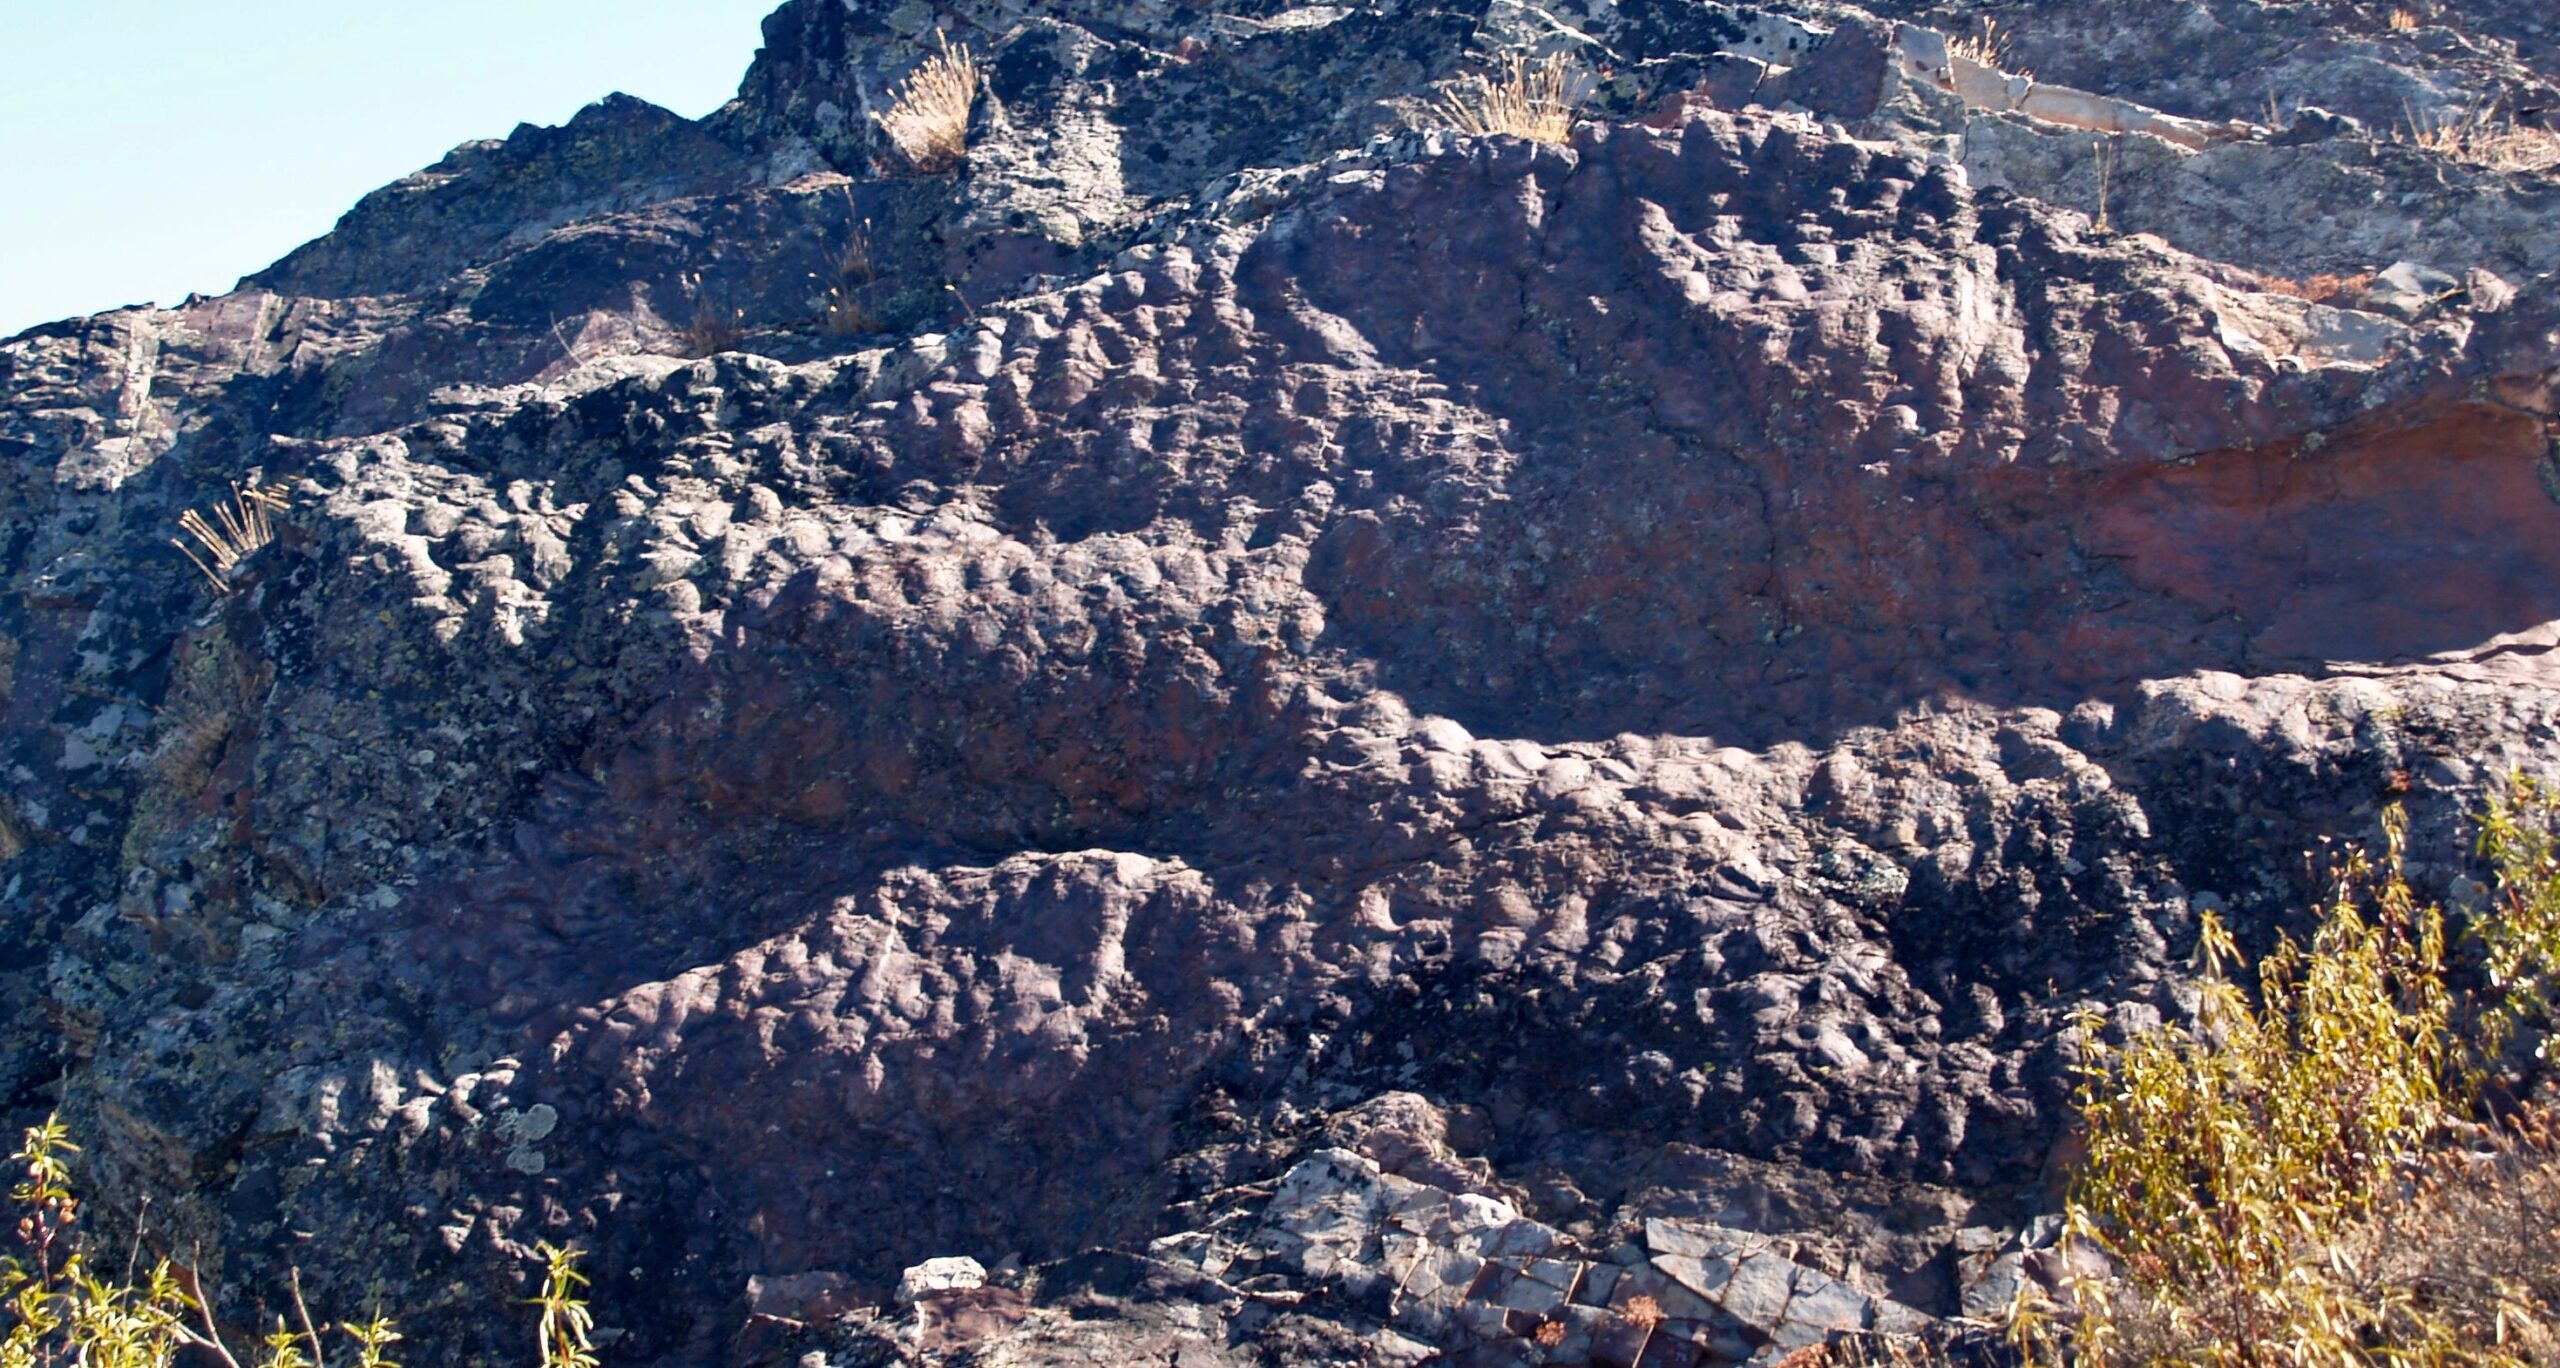
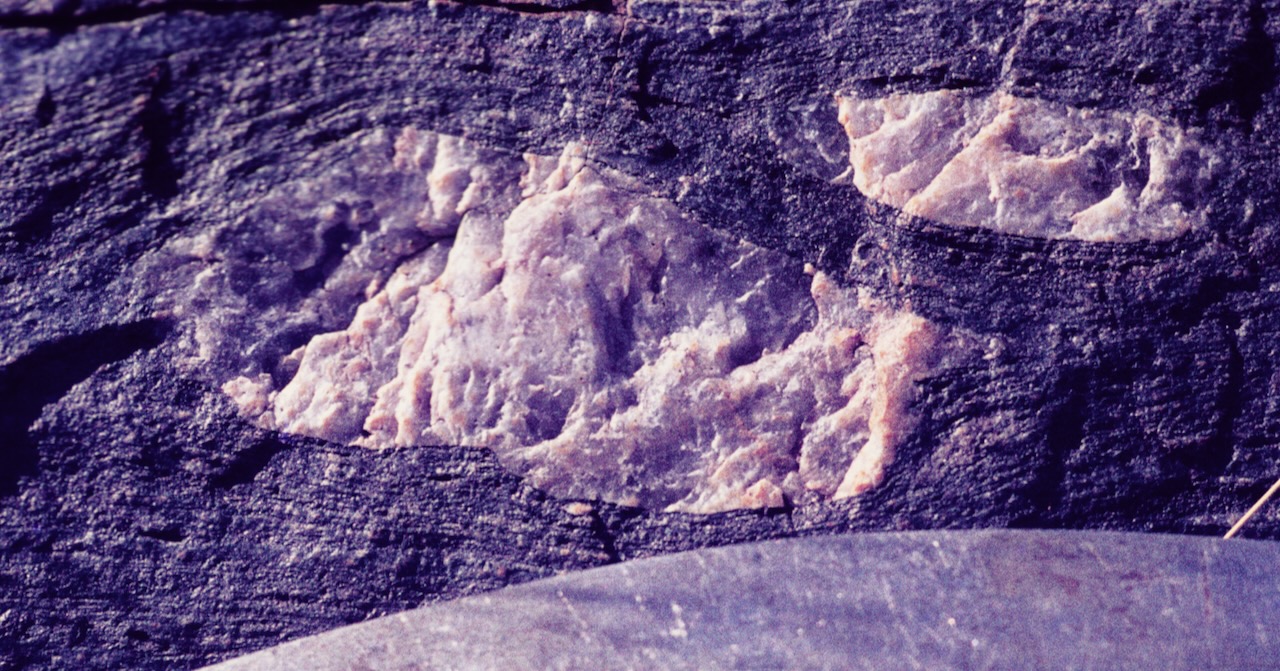
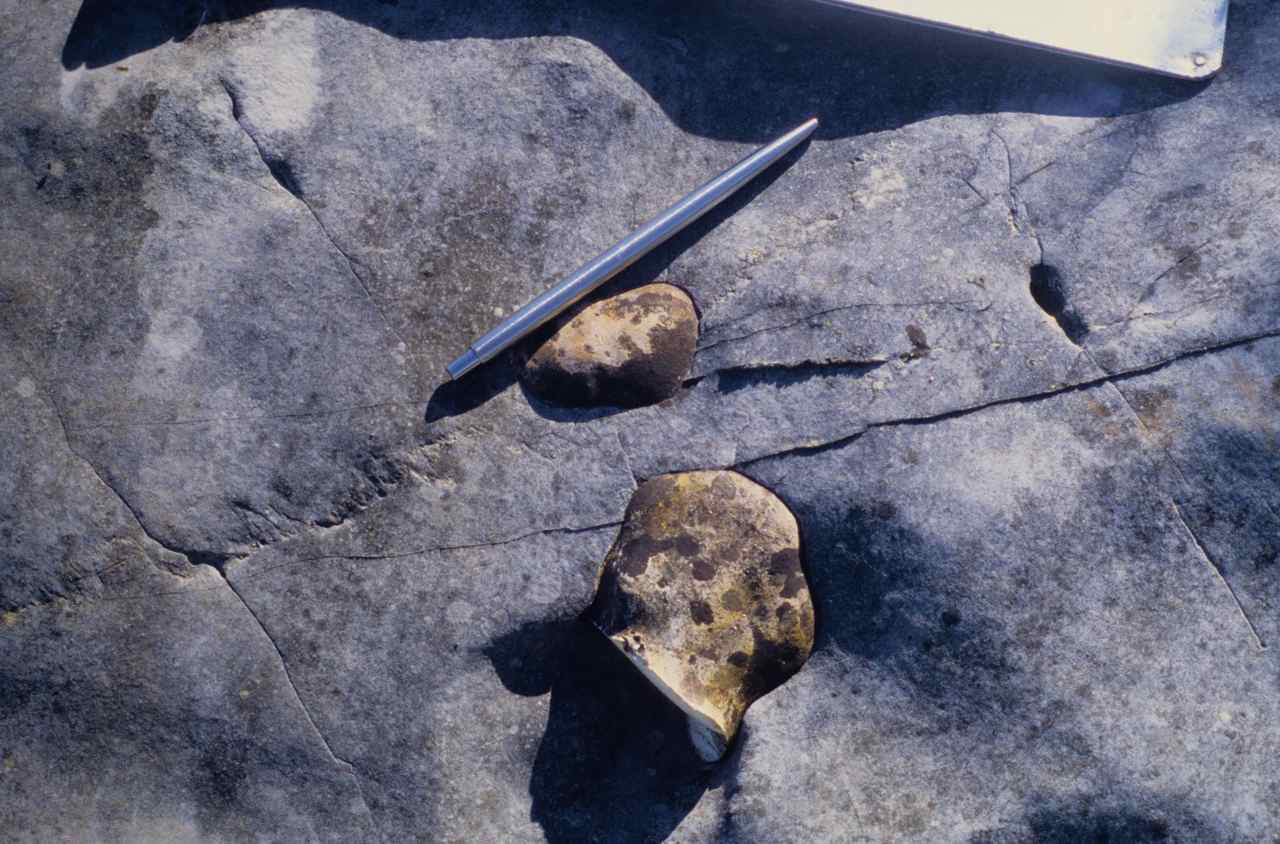
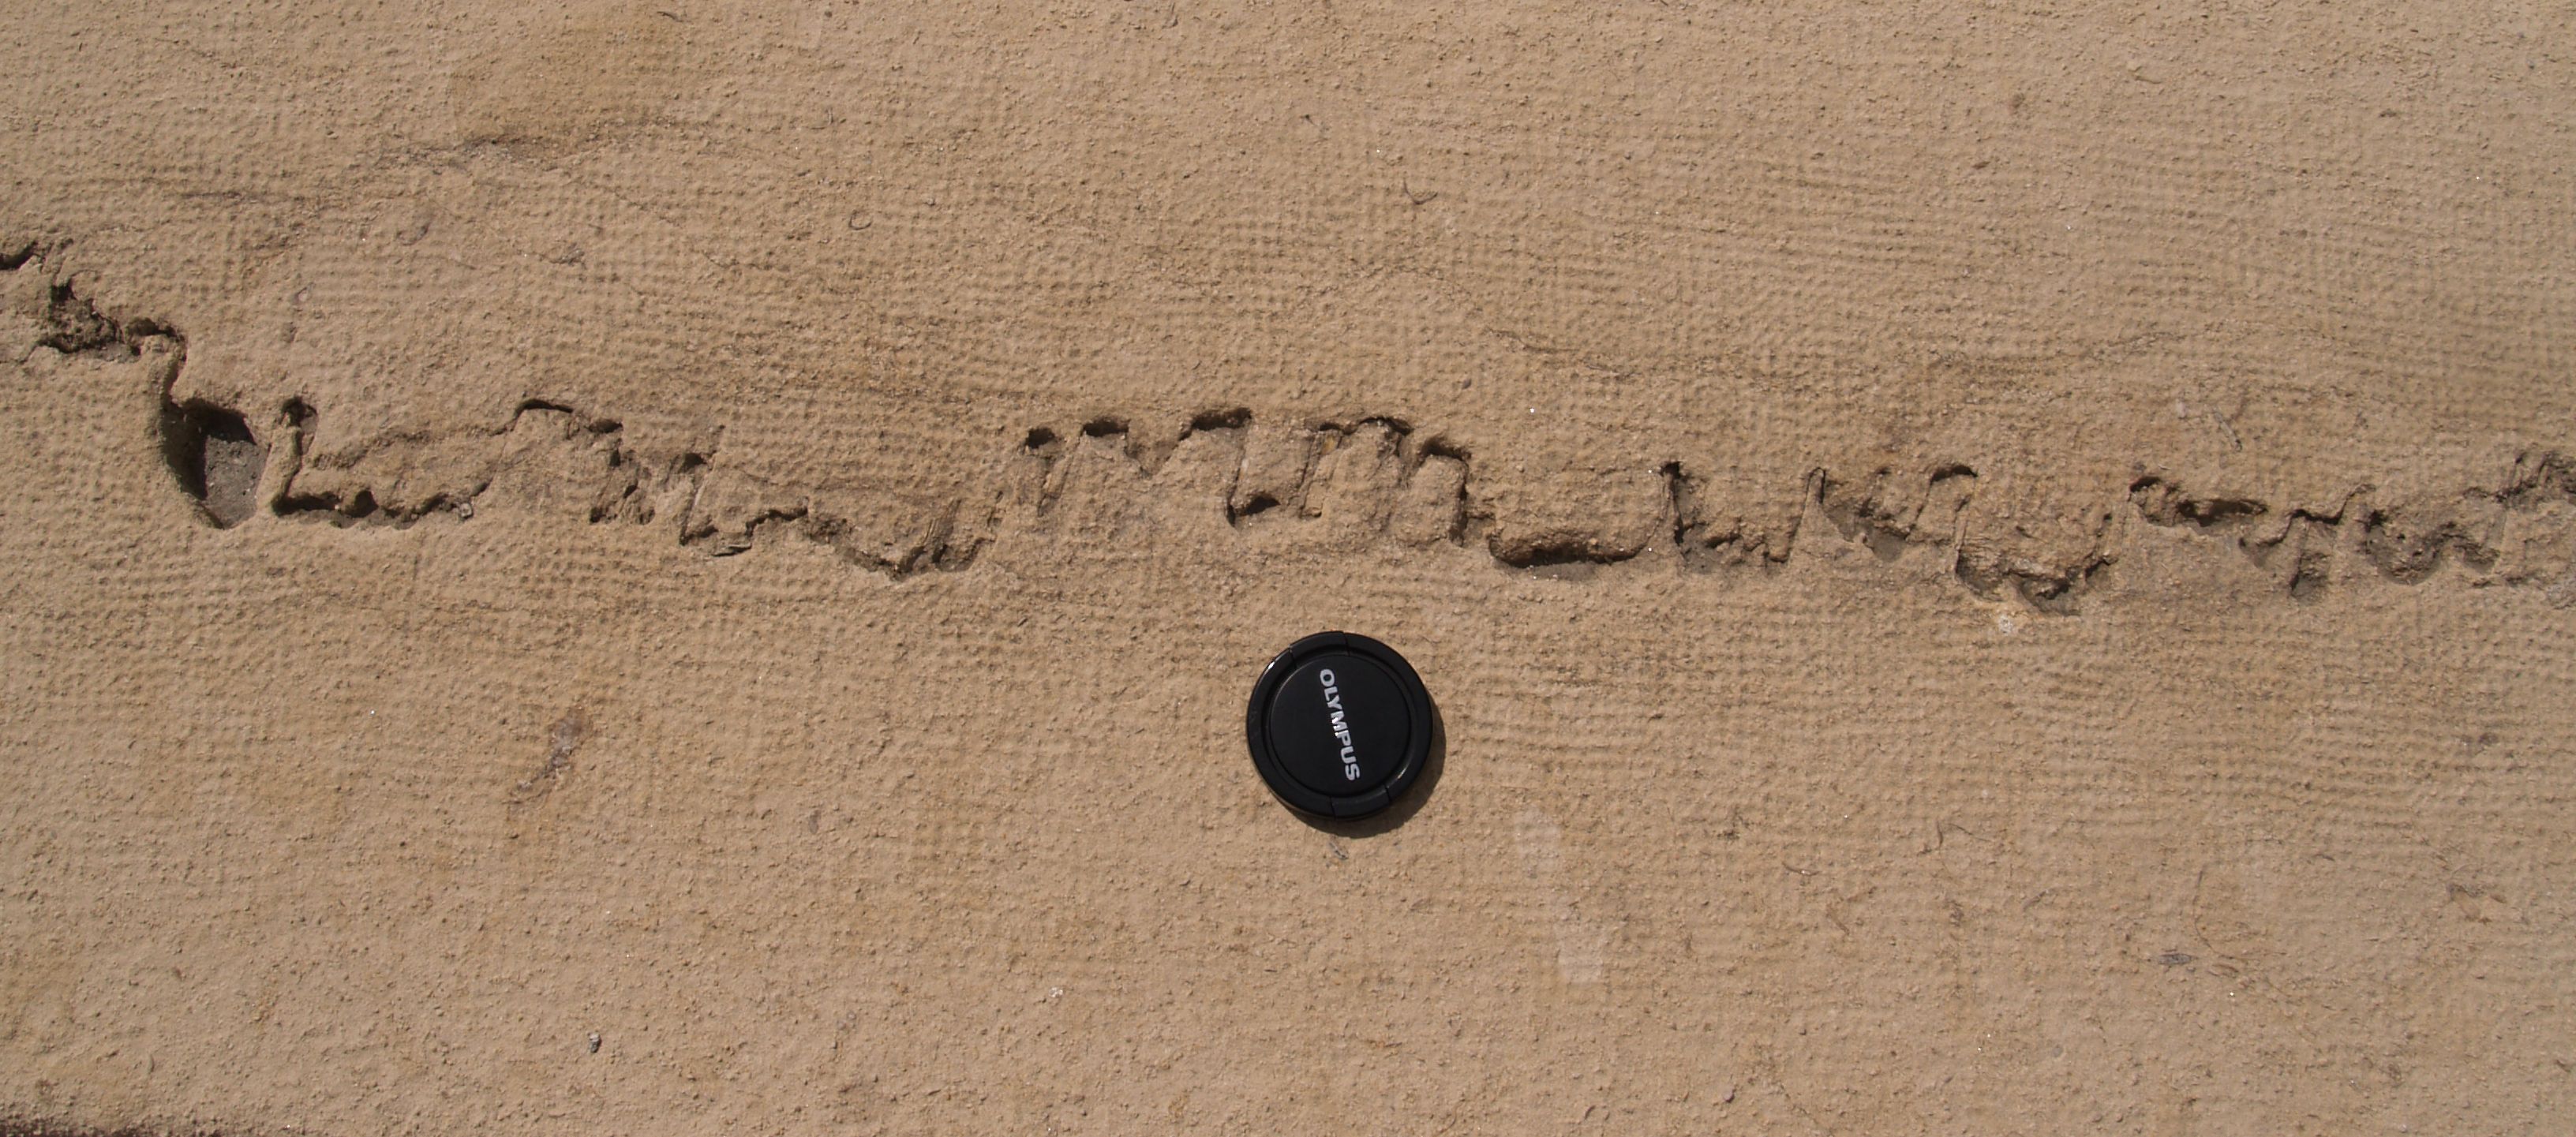
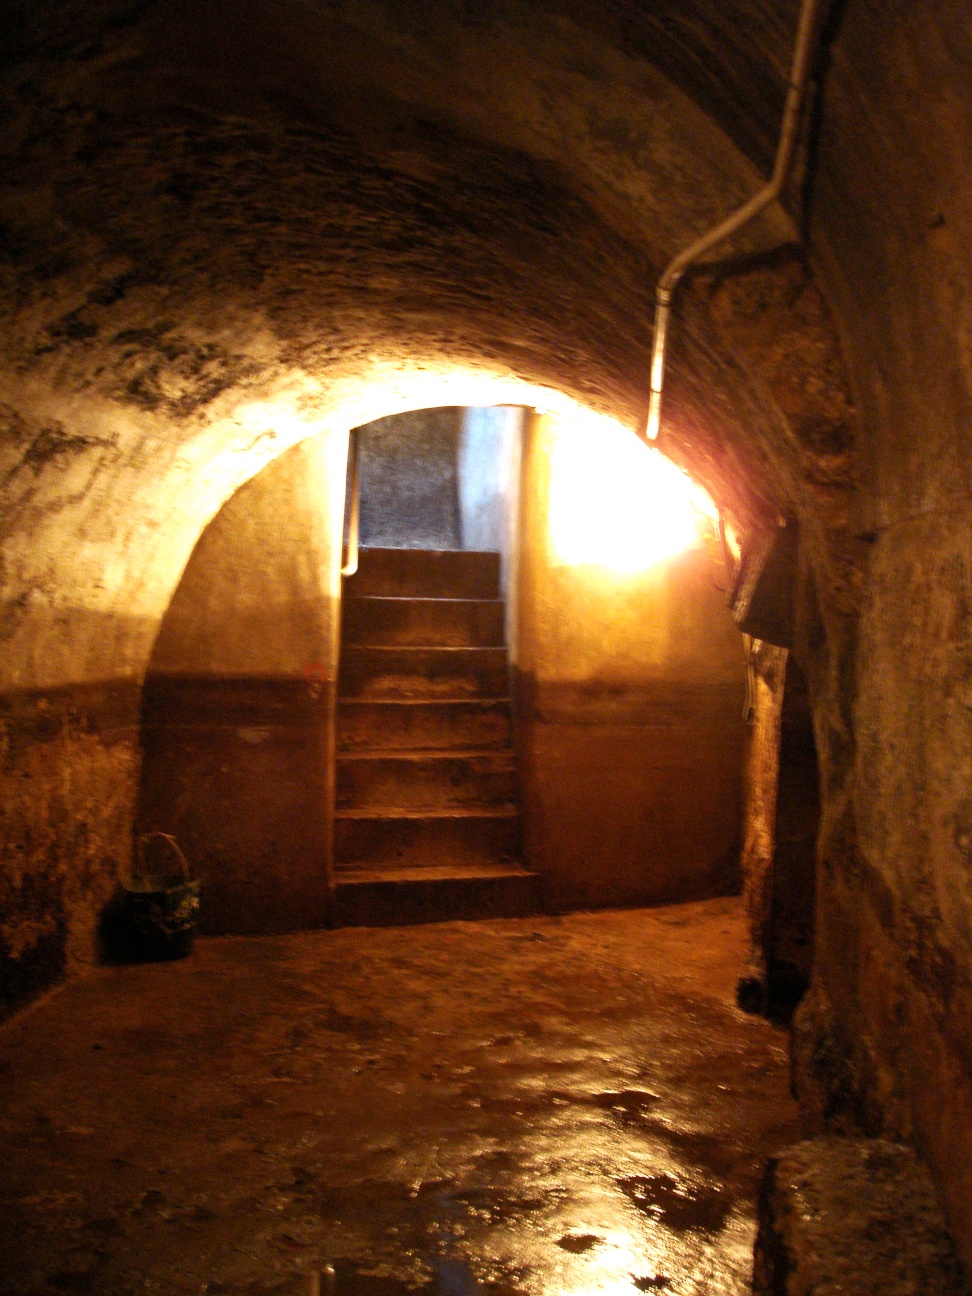
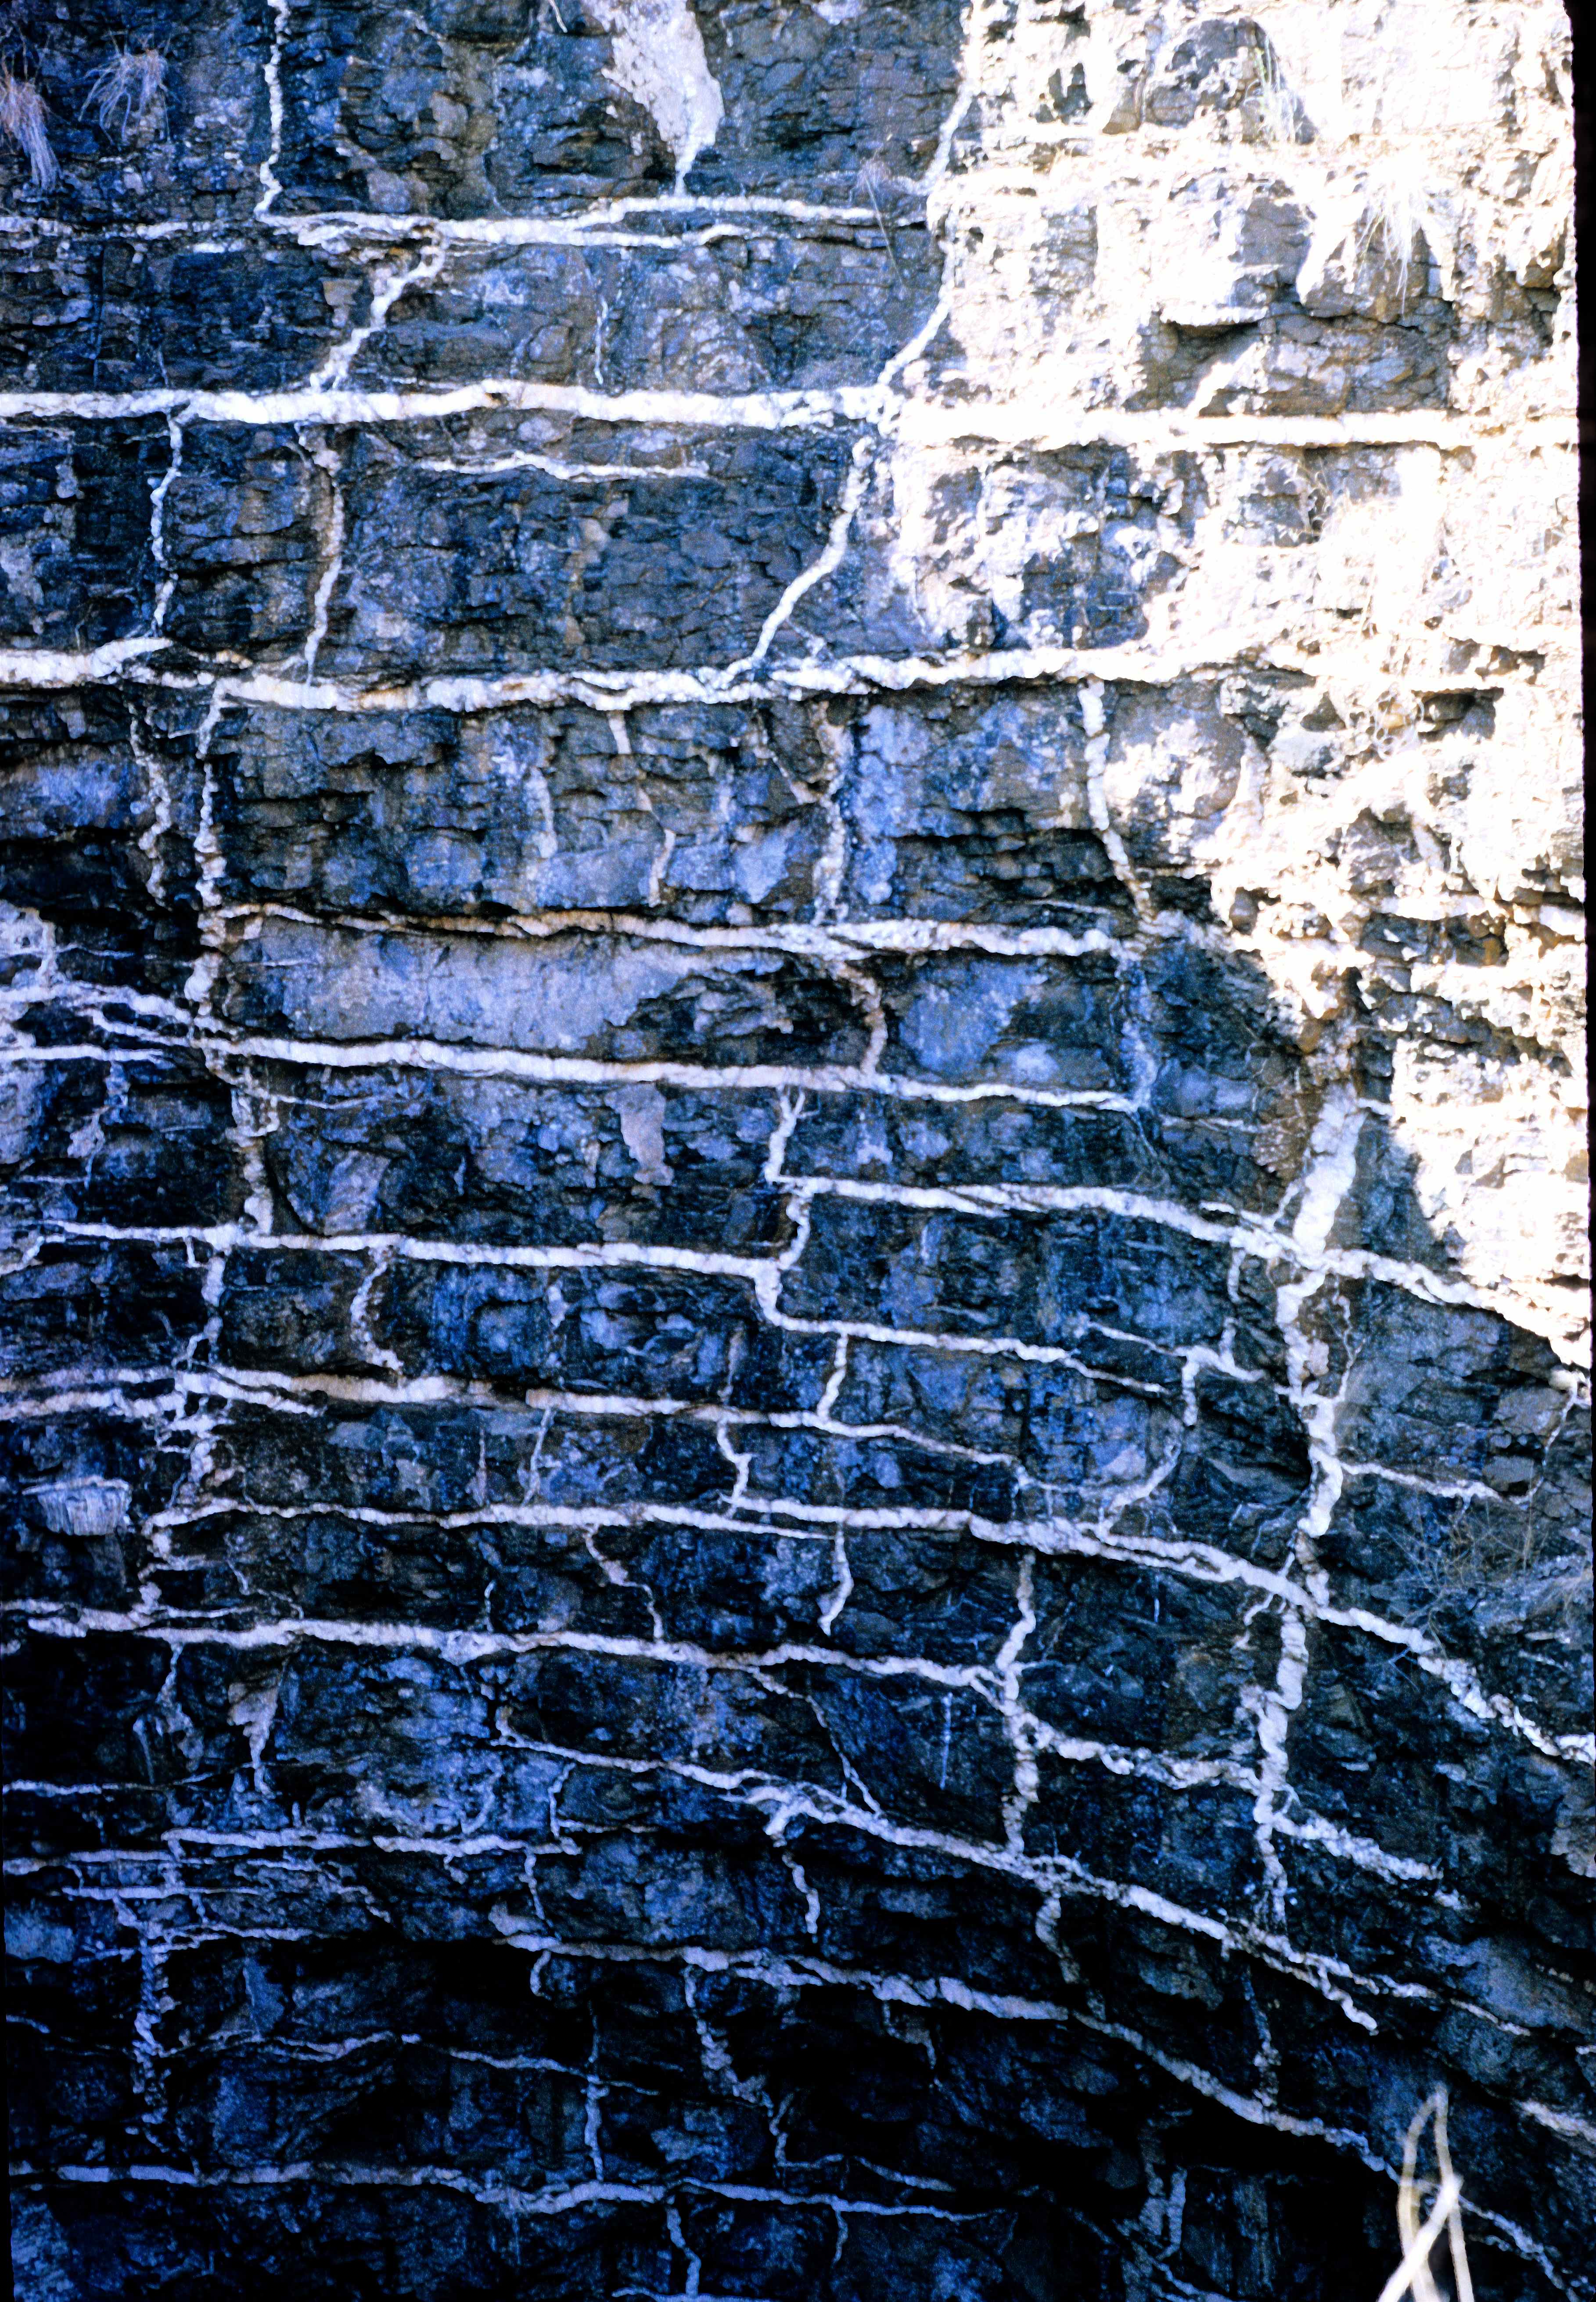
As technology progressed people realised they could improve on the natural jointing by using very simple chisels for digging grooves along predetermined lines, in order to create an artificial joint through which the rock would fracture. A good example can be seen within the Moorish castle at Sintra, Portugal (Fig. 164), built during the 8th century.

Figure 164 – Inner view of the Moorish castle wall (Sintra, Portugal).
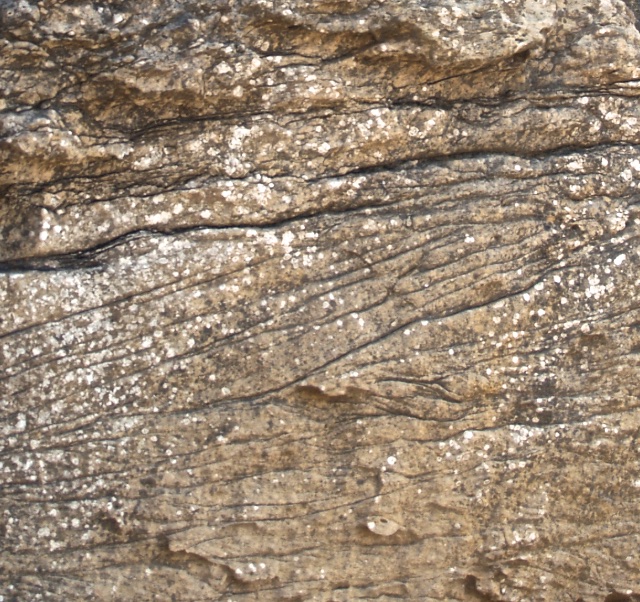
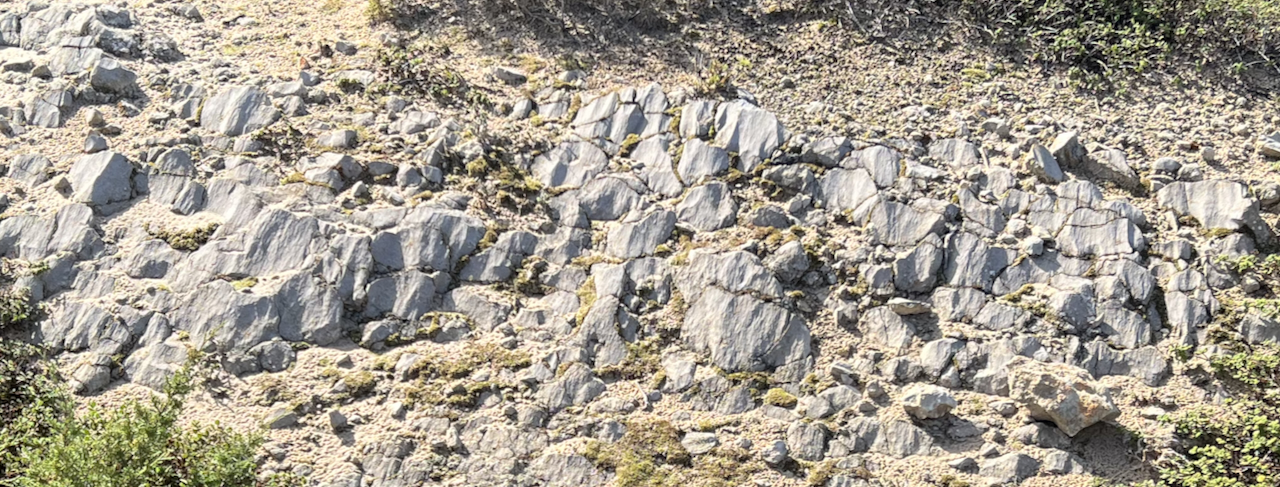
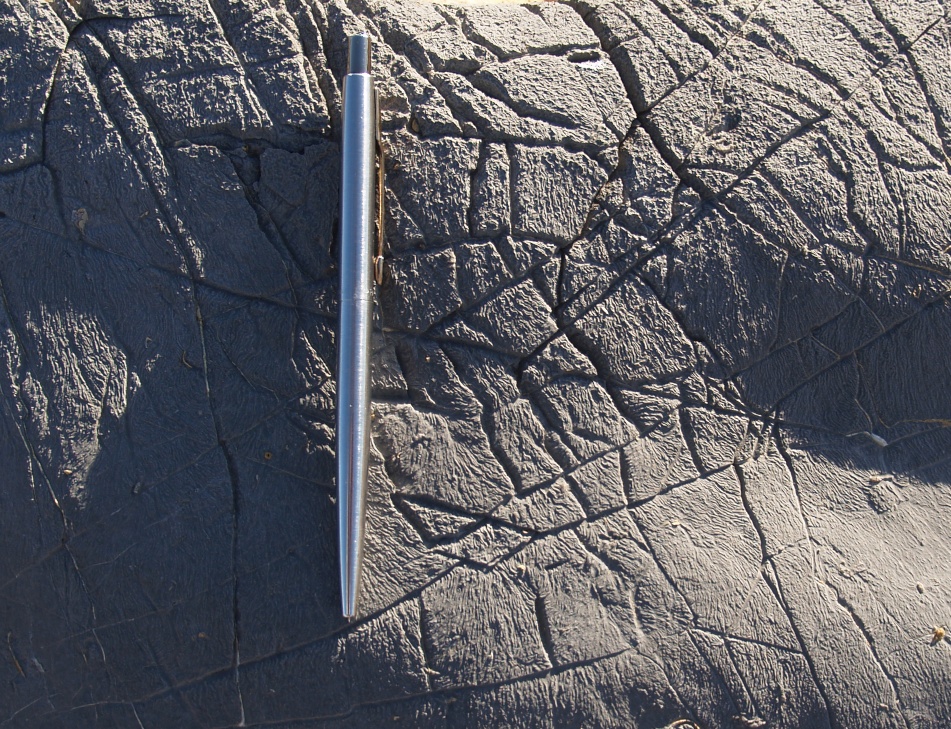
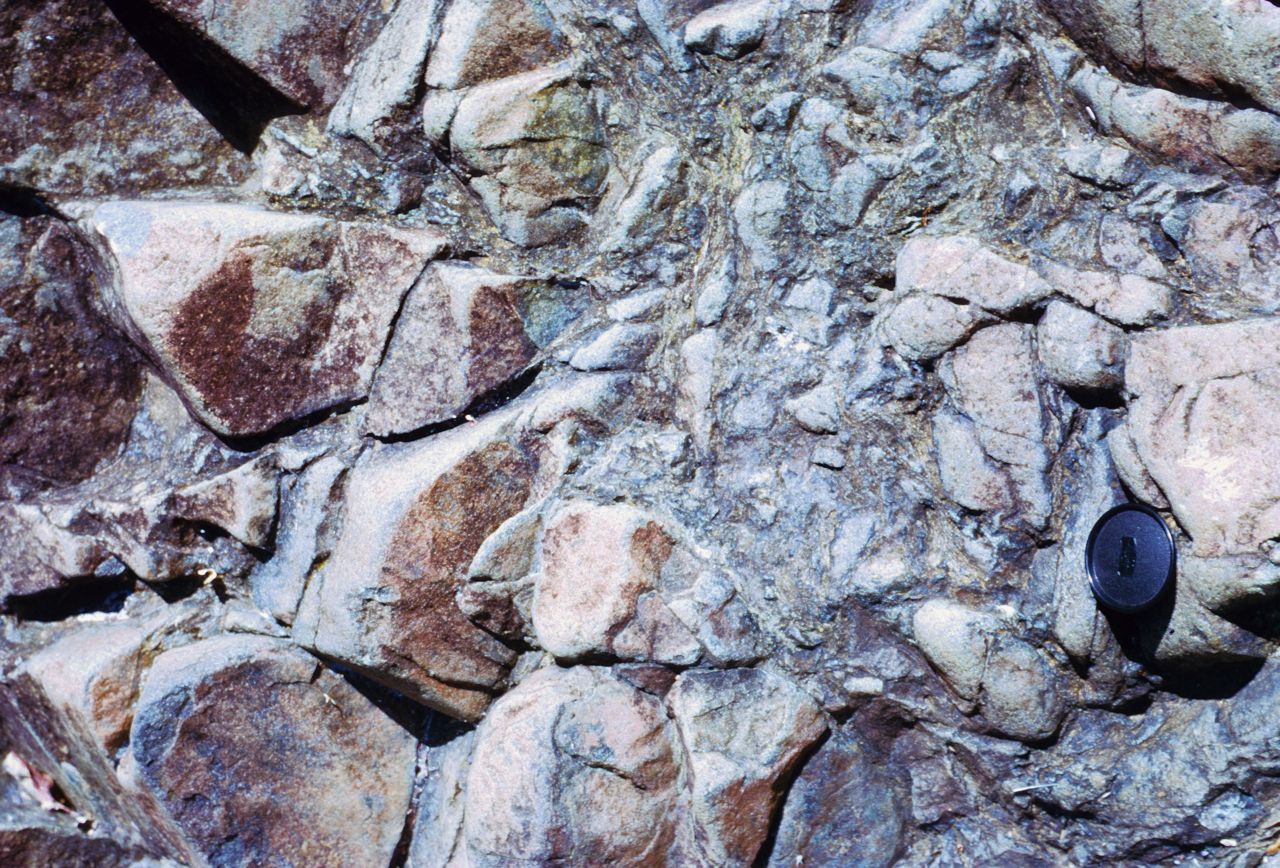
As figure 165 shows, two lines of grooves were chiseled on the granite boulder located within the castle area, and along one of them a neat break had already been accomplished. Surely this is a block in preparation for repairing the wall.

Figure 165 – Granite boulder halfway split to shape a block for the castle wall (Sintra, Portugal).
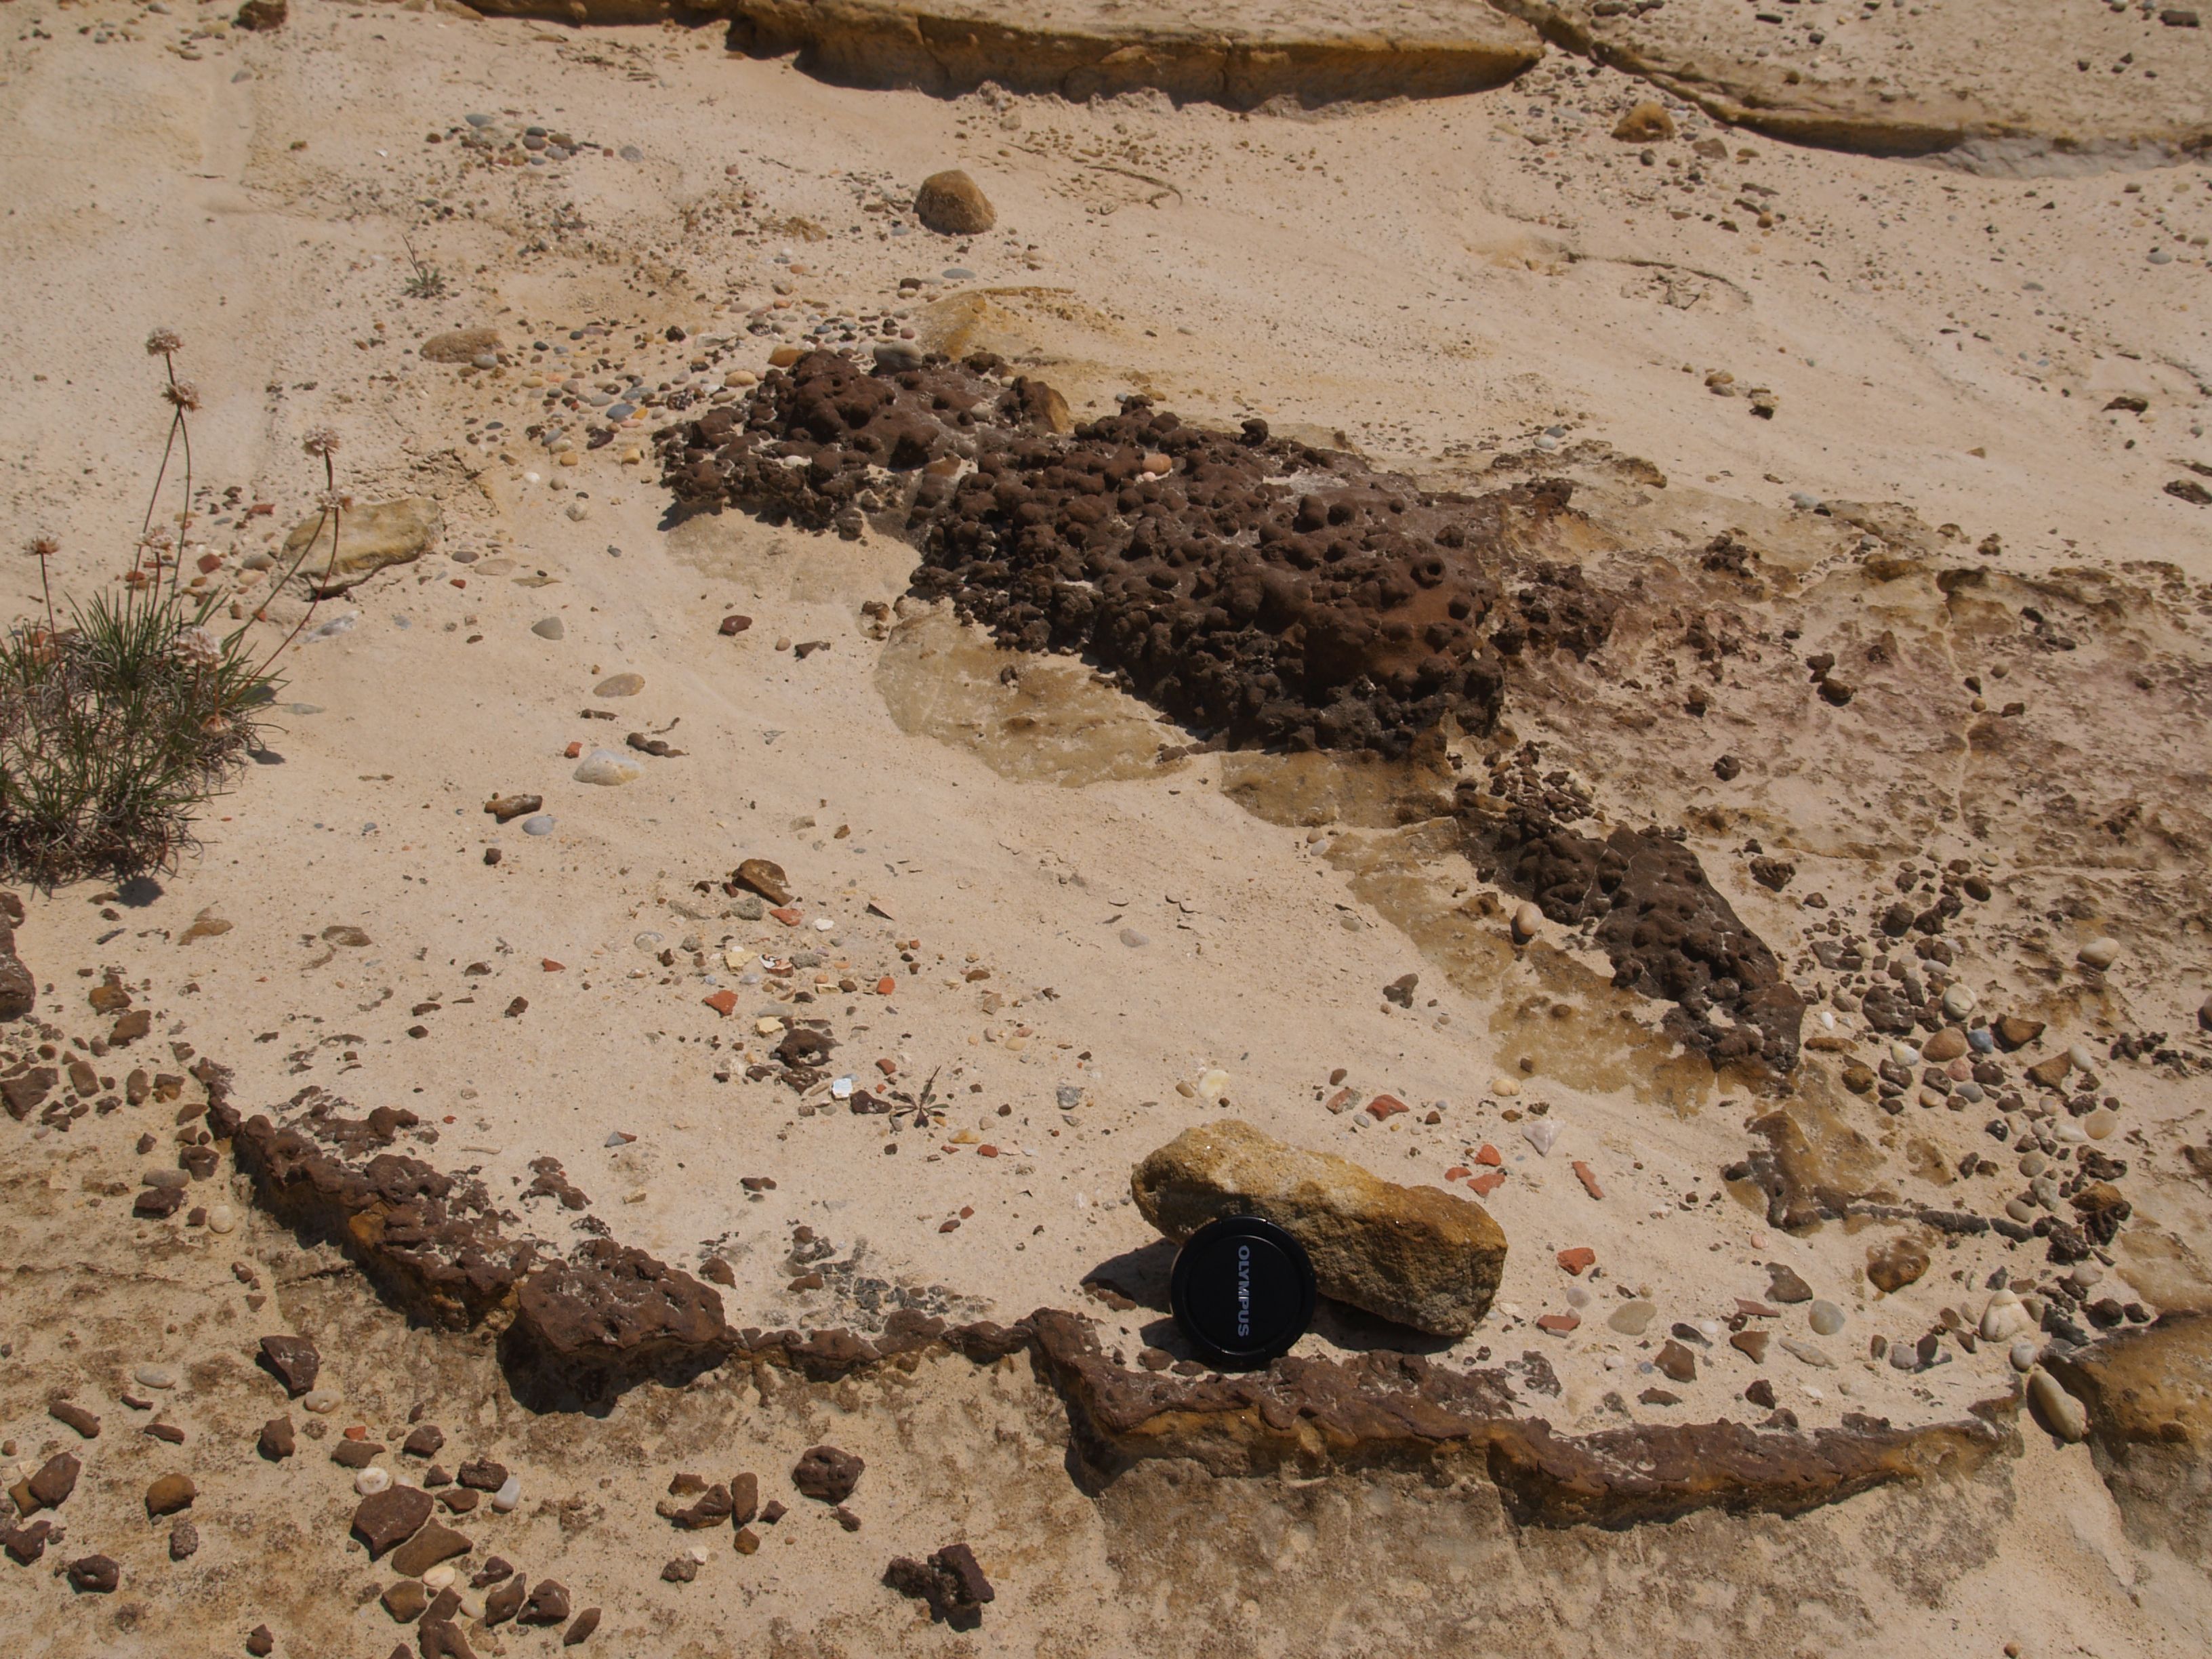
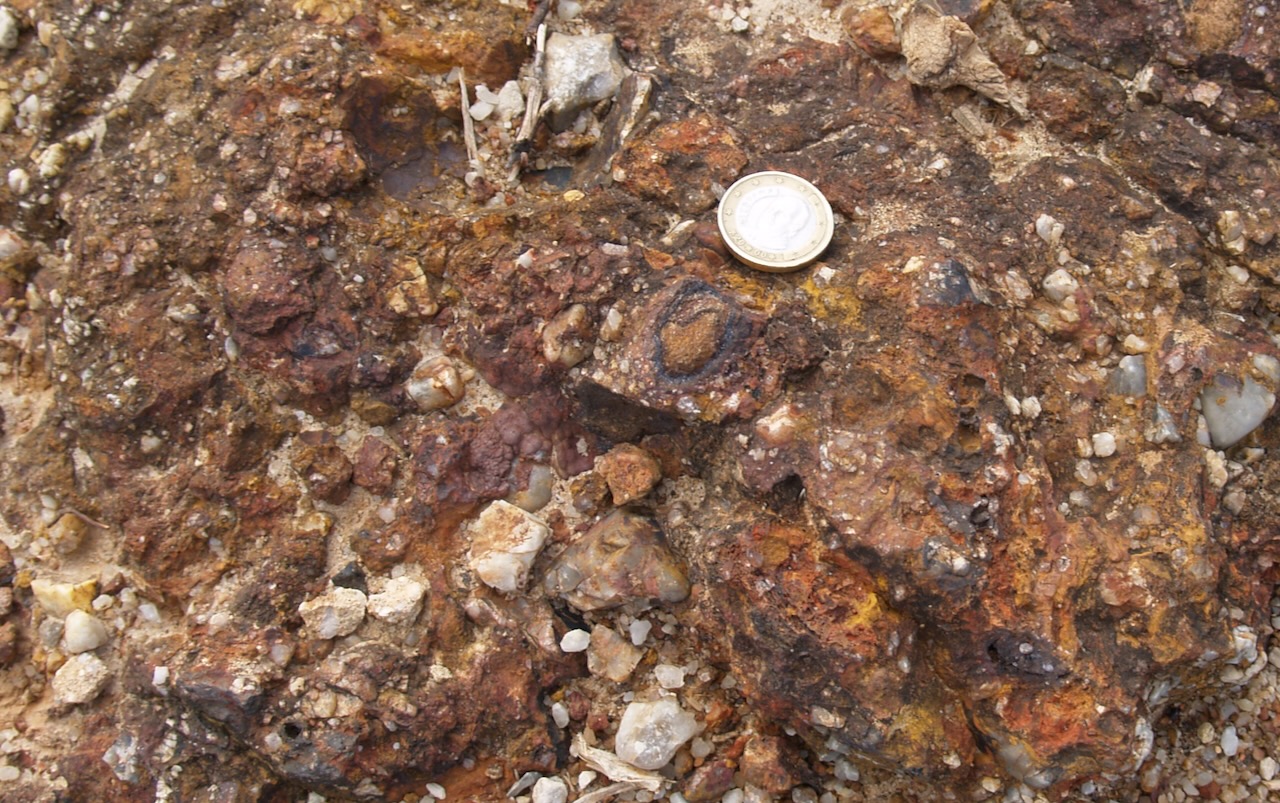
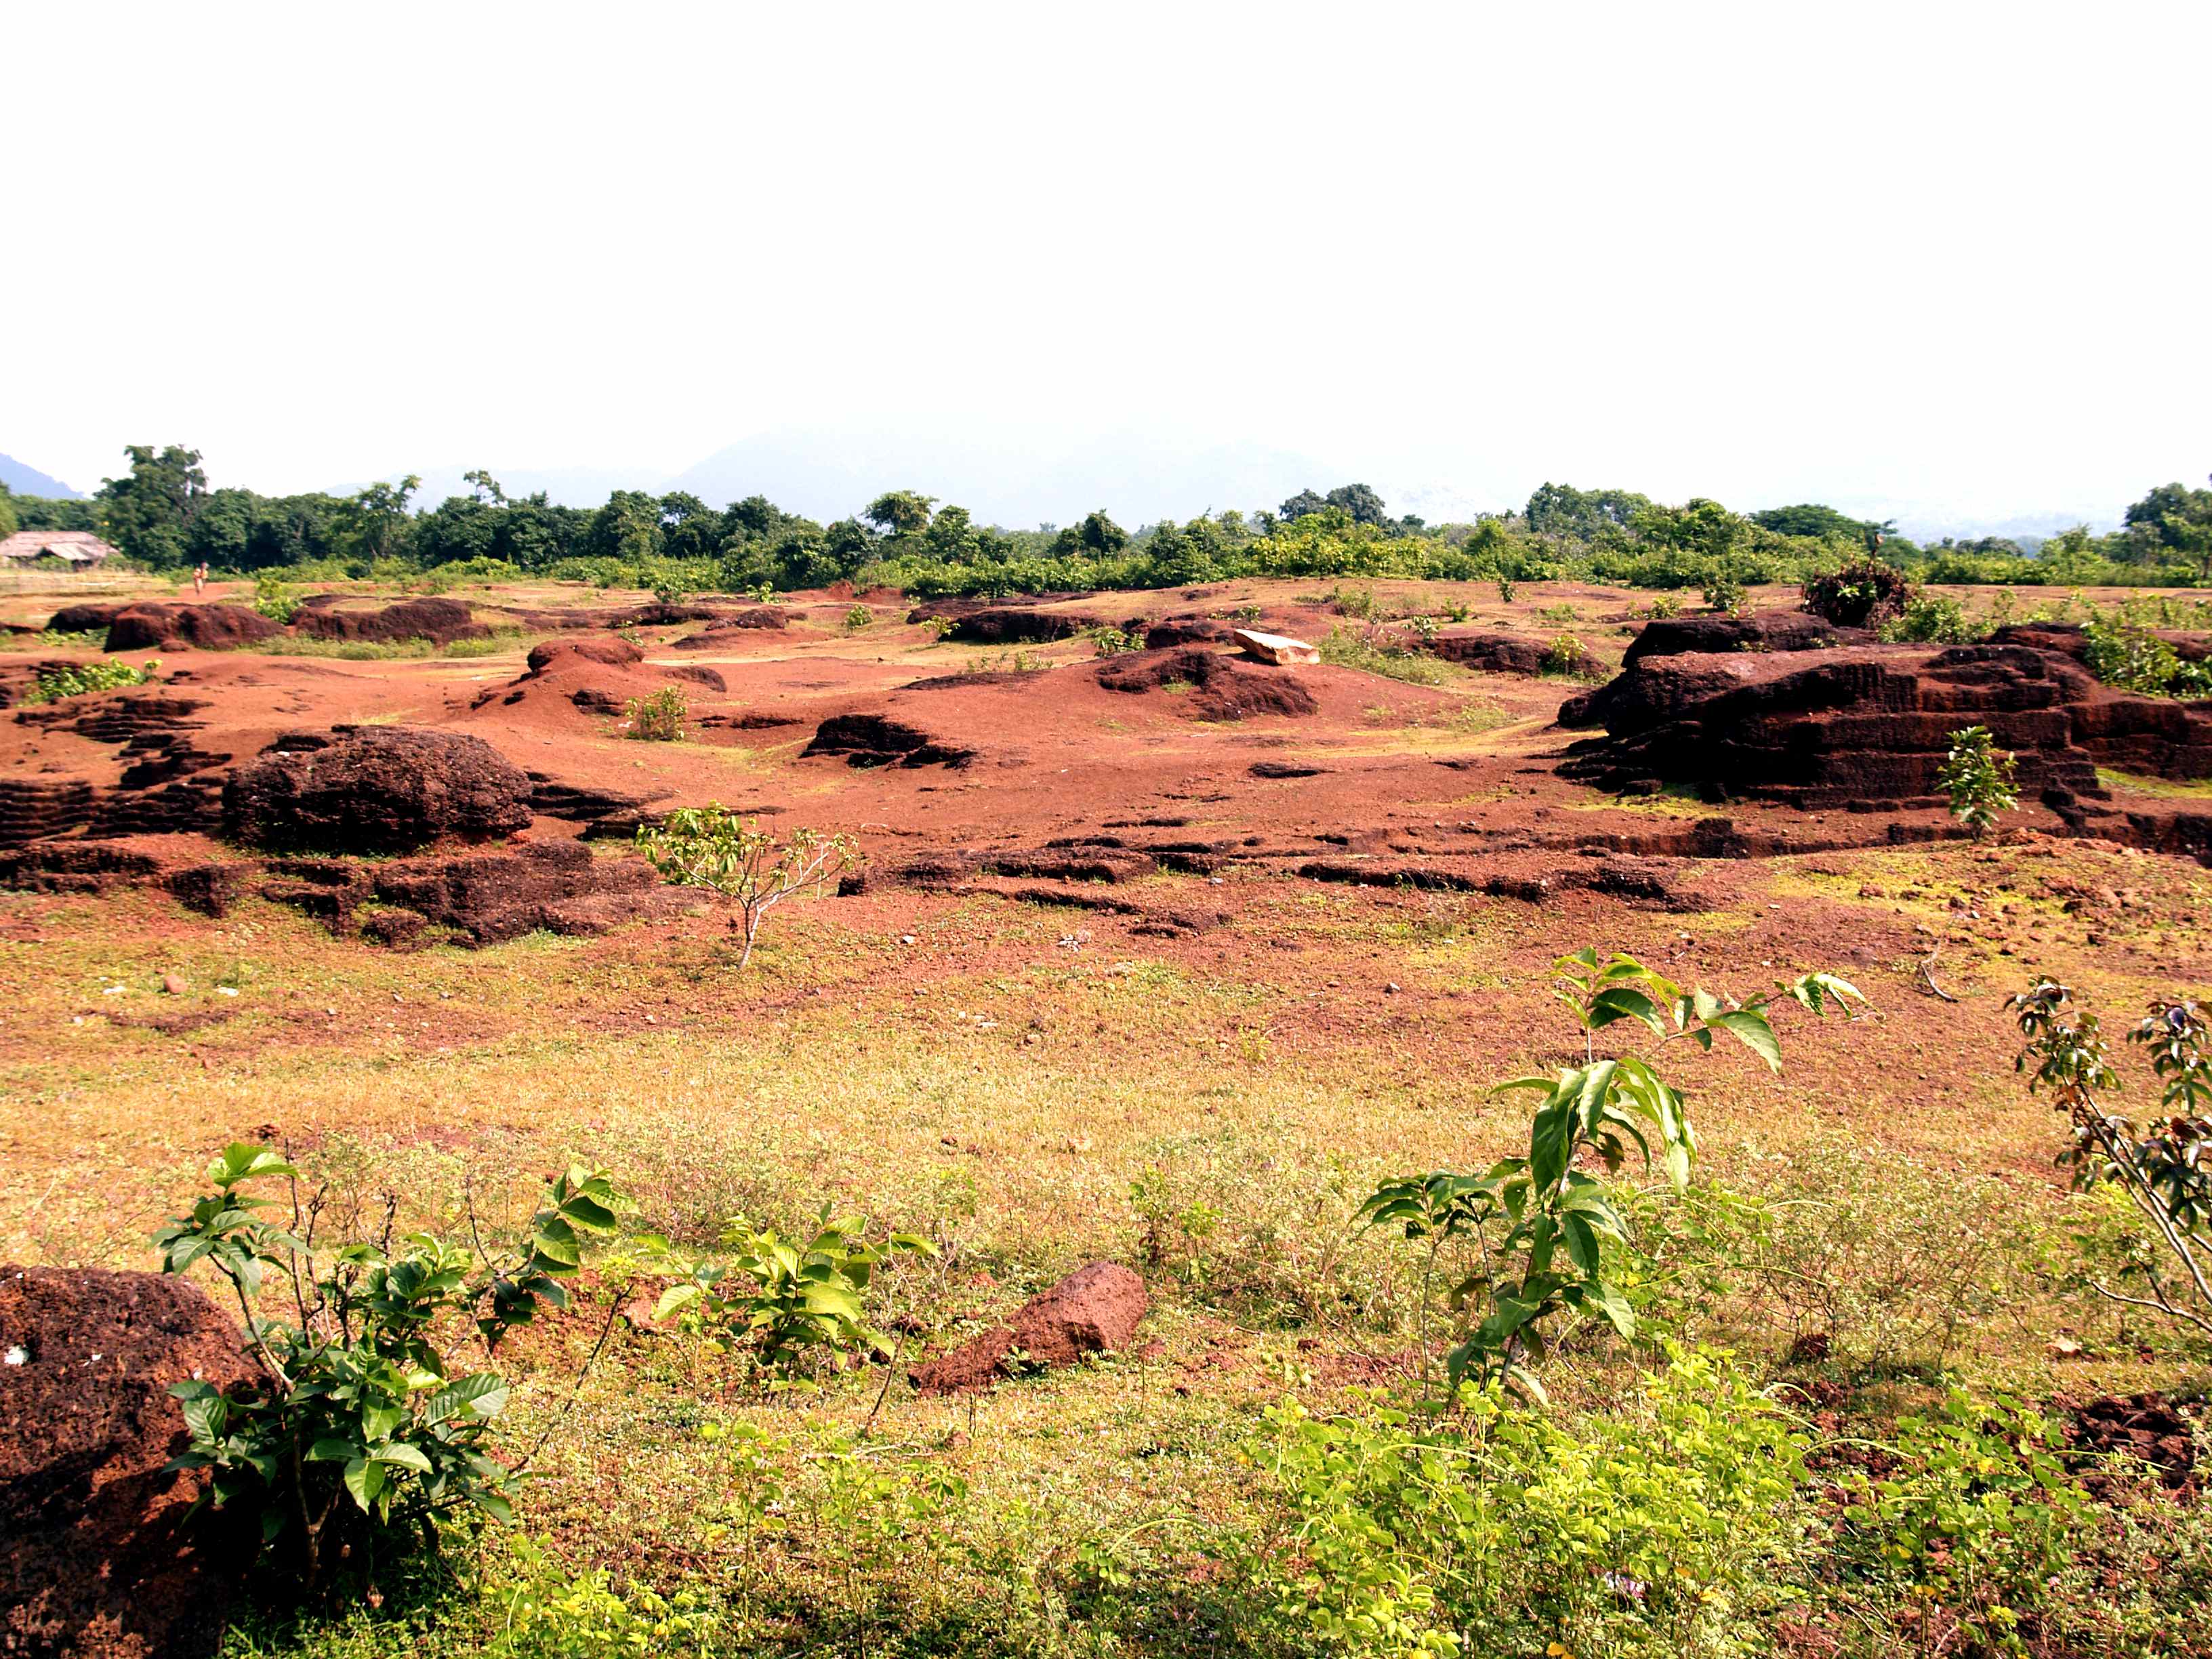
Just as primitive, is the use of laterite for the construction of houses. This material occurs in regions with high precipitation. India is a great example, with their well known monsoons. There, I saw laterite being mined (fig. 31D) by cutting it in blocks (fig. 166) for the construction of houses. These blocks are rather large, about 0.5 x 0.3 x 0.1 metres but they are not too heavy, so they can be handled reasonably easily. Also, I was told no cementing material is needed since, with time and the enormous amounts of rain they have, the iron in the laterite is mobilised some more and the blocks seal themselves.
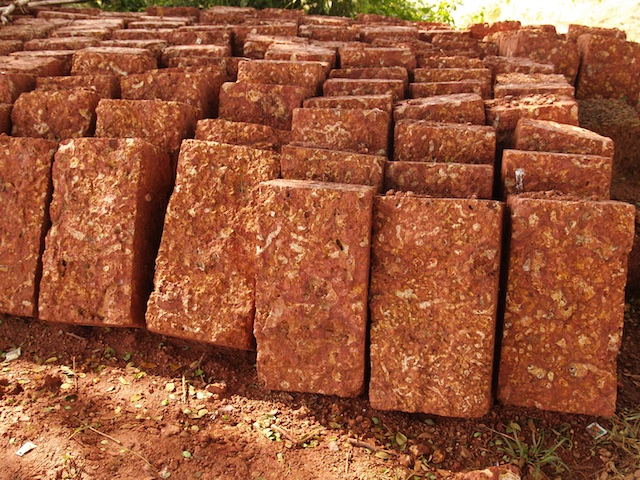
Figure 166 – Laterite construction blocks (Orissa, India).
9.2 SIMPLE EXTRACTION
With the present technology, inert materials can be extracted in many sophisticated ways. Here I just refer to some which have been extracted since time immemorial and even today are extracted in a relatively simple manner. River sand dredging (fig. 166) is one of them. This job that initially was done entirely manually is now done in a totally mechanised manner.

Figure 167 – Sand dredging (Douro River, Portugal).
Note that this sand is not extracted to permit navigation, but rather for construction. A consequence of this huge and continuous suction of sand, is the rejuvenation of the river’s energy level, thus increasing enormously its erosional power, with disastrous consequences for bridges, etc. To me this is a very short sighted approach because sand of the same quality can be obtained by minor additional processing of the fines which develop at stone crushers, and otherwise has to be discarded as waste, occupying unnecessary space an adding costs to the final rehabilitation.
Continuing with rivers, there is also the mining of gold and diamonds, which originally was done by panning but now, even though done using more mechanical methods, can still be considered a one man operation, with very few helpers. The example I show, is for diamonds along the Vaal River, in South Africa (item 6.4.1, fig. 99), where a rather simple but effective mechanical method of grading the clasts is being used (fig. 168),

Figure 168 – Mechanical size sorting of the river gravel (Ulco Area, Vaal River, South Africa).
and figure 169 showing the owner of the enterprise doing the final sorting. It was impressive how fast his hand moved, but I do not think many diamonds were missed.

Figure 169 – Final hand sorting for diamonds (Ulco Area, Vaal River, South Africa).
Another one man operation I came across, was the mining of a gold rich quartz vein in what was still Rhodesia. Actually, in this case it was a partnership of two. This time a grader was not necessary, but rather a stamping mill (figure 170) to crush the ore, which is also rather simple but very effective.

Figure 170 – One man gold mine operation, ore stamping mill (Bulawayo region, Rhodesia).
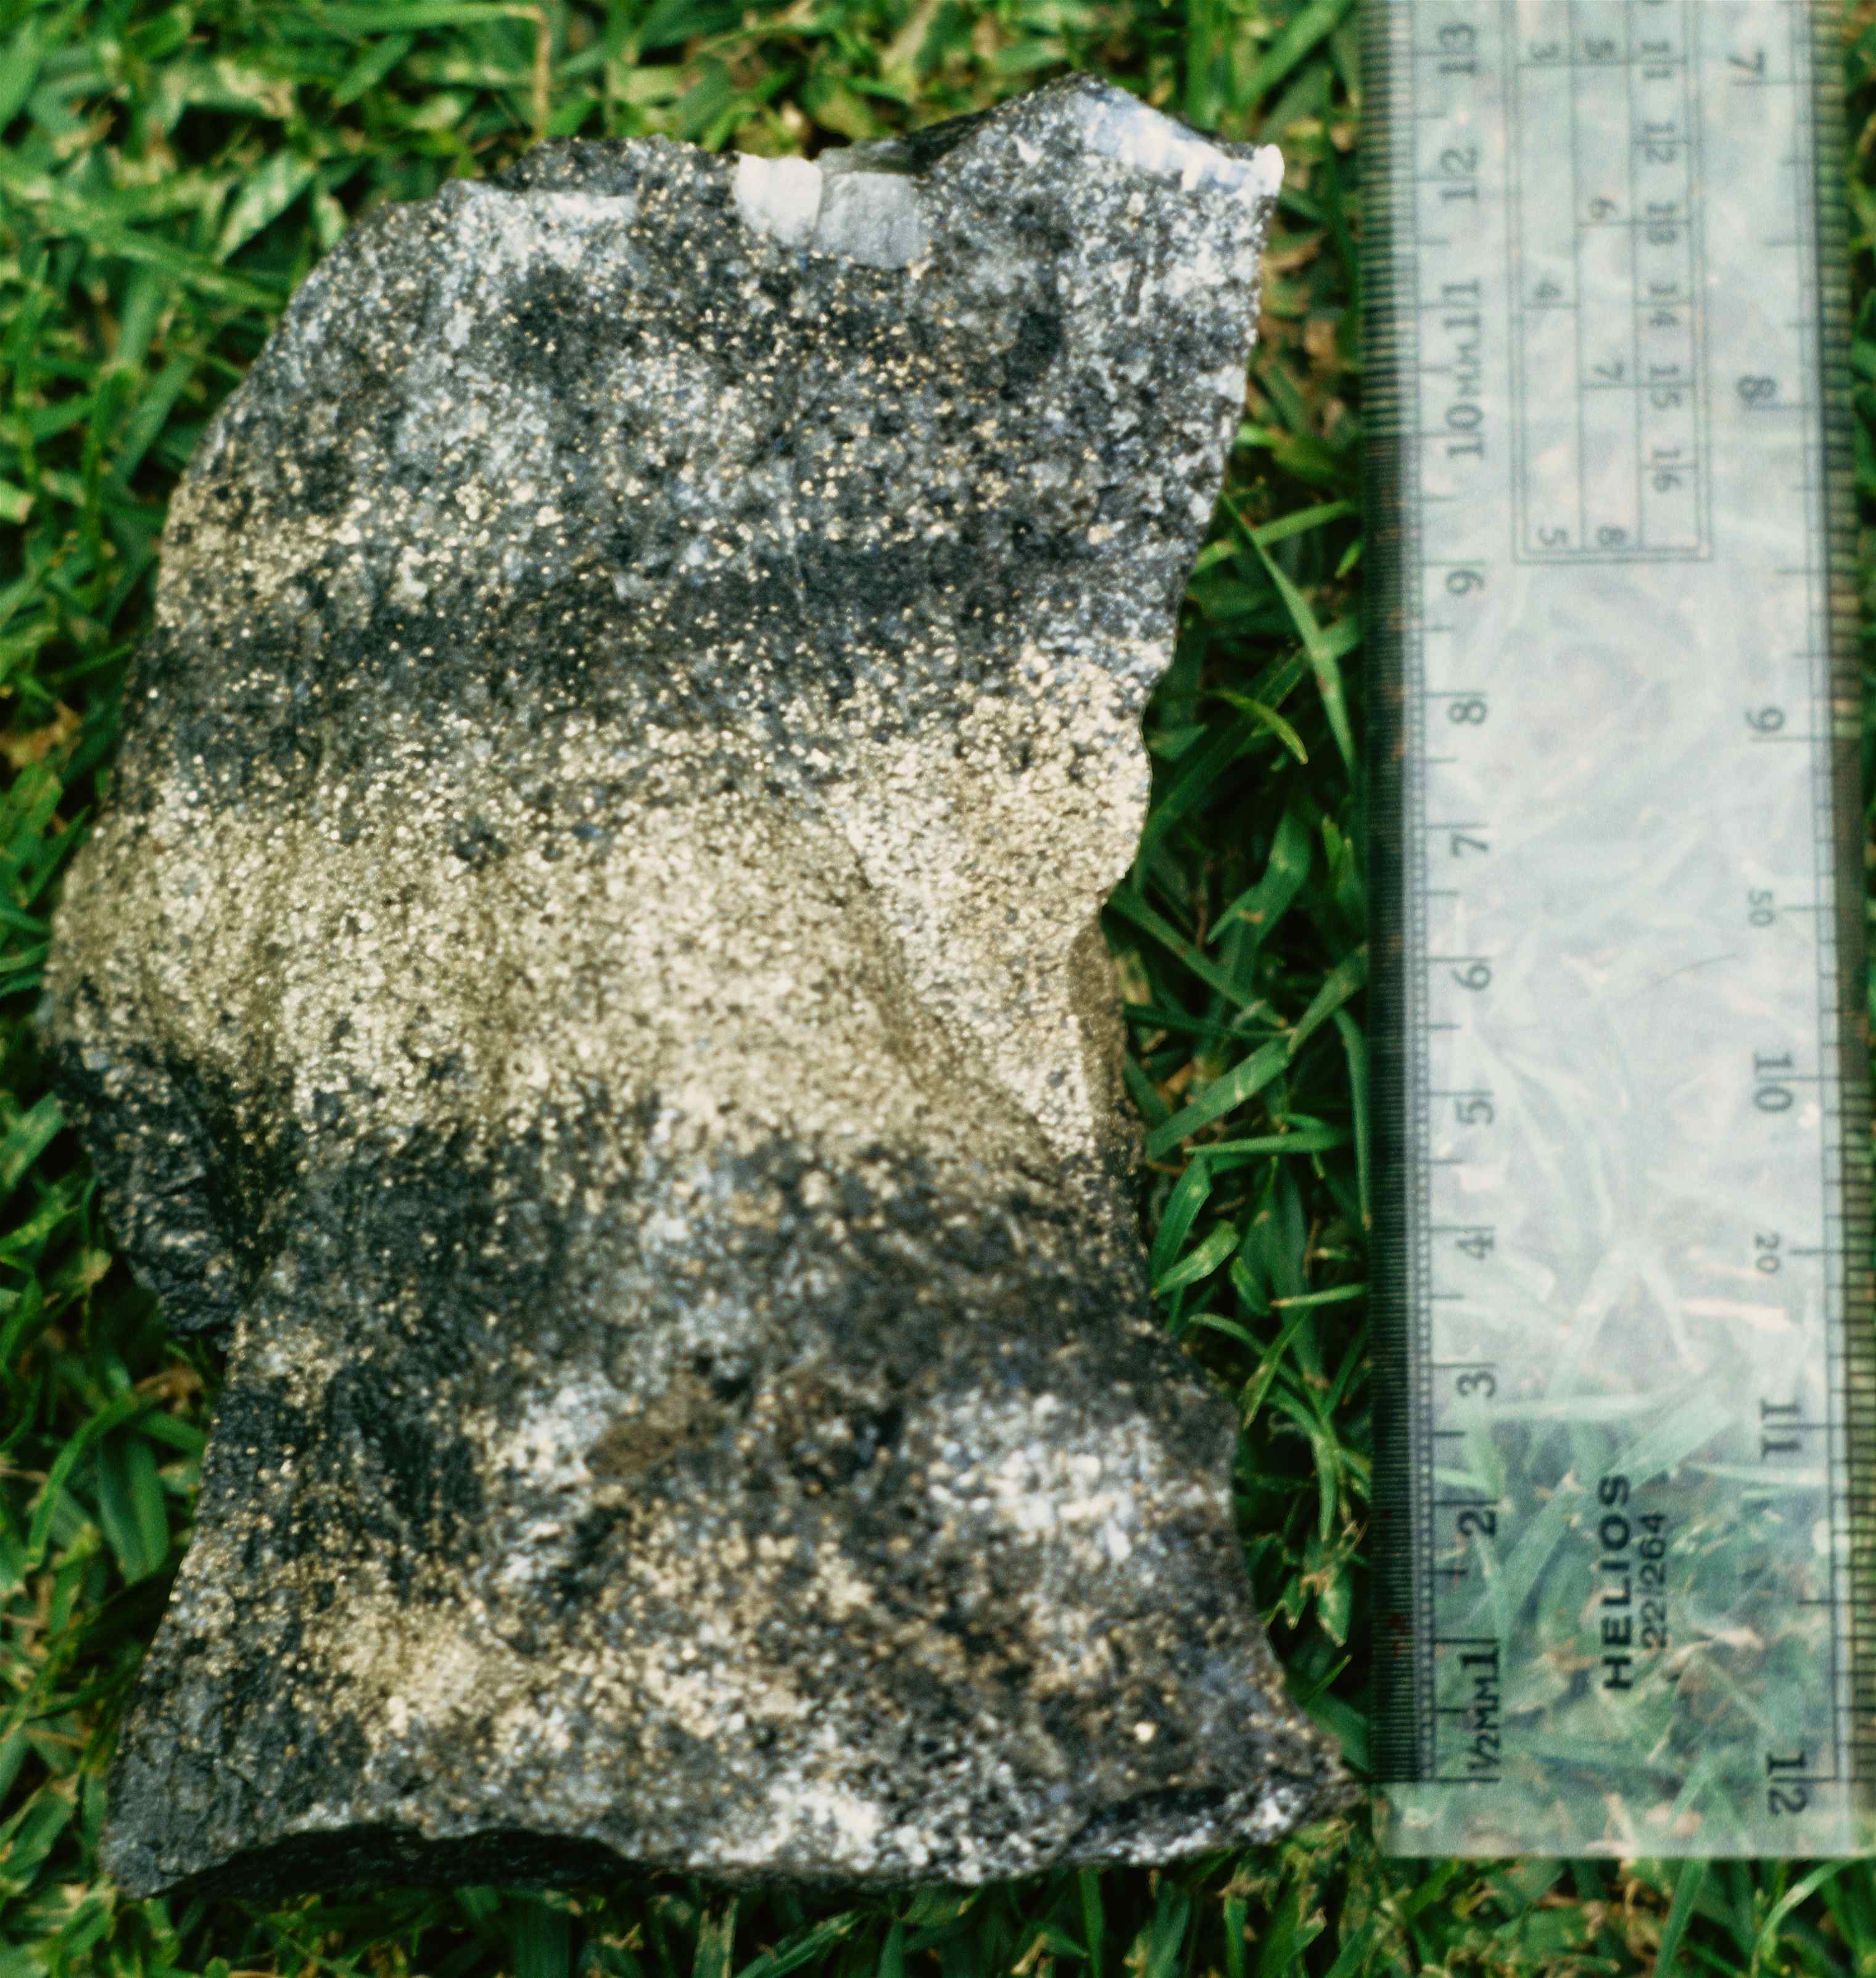
Needed too, was a vibrating table to sort the heavy material (fig. 171). Note the pale, rather thick streak of heavies at the top of the table, on the left hand side. Unfortunately for the owners, this streak was not just gold but rather predominately sulphides with minor gold specks. For the final separation they were still using mercury which makes an amalgam with the gold, and then the mercury was “boiled out”.

Figure 171 – Vibrating table (Bulawayo region, Rhodesia)
9.3 OPEN CAST
As the name indicates, open cast means mining on the surface. Of these, the simplest is the extraction of stone for construction and since there is construction everywhere, stone quarries also exist everywhere. Here I only want to show not so much the importance of the health regulations but rather, their implementation. Figure 172 shows an entirely dustless loading operation in a granite quarry in South Africa,

Figure 172 – Dust free dump loading operation in a quarry (Halfwayhouse, South Africa).
and figure 173 shows a limestone quarry in Portugal with so much dust, that one has difficulty in distinguishing the crusher unit on the right hand side. Probably, because Portugal belongs to the EU, its mining laws are actually more strict than those in South Africa but, obviously in Portugal there is no apparent law enforcement, since the photo was taken from a moderately important road with considerable traffic of all sorts.

Figure 173 – Quarry with no dust prevention (Serra de Janeares, Portugal).
This is sad because quarry dust is easily prevented by simply spraying the haul roads, the blast heaps, as well as all the crushing units. That is, all the sectors where dust may develop, with the exception of course, of the dust caused by the blast (fig. 174).

Figure 174 – Blasting in progress (Ulco, South Africa).
For obvious reasons, this regulation is extremely important and, in Portugal, where water is abundant, it is not even expensive to implement. On the other hand this is not so in many parts of South Africa like Ulco, which has a very arid climate and consequently where water is difficult to obtain. Even then however, for the workers’ health sake, the quarries are maintained dust free. Going still further, at Ulco there is not only a stone quarry, but also a cement and lime factory, that is, additional potential sectors of large quantities of dust development but, as figure 175 shows, there is none.

Figure 175 – Ulco from the air, with the township on the right, the quarry in the middle, and the factory complex on the left (South Africa).
Still to do with construction and ornamental stone we look now at the extraction of marble. The interesting aspect here is that technology has already managed to do away with blasting, which used to cause a lot of wastage due to excessive and uncontrolled cracking of the rock, even under very cautious controlled methods. Nowadays a diamond wire is used, that is, a wire line impregnated with diamond chips. Figure 176 shows the control unit as well as the two sides of the wire loop. On the far side, out of the picture, there is a pulley positioned in such a fashion that the wire is in continuous contact with the marble to be cut. In other words it is a sort of band saw.

Figure 176 – Wire cutter at a marble quarry (Portalegre region, Portugal).
I can not resist going back to the problem of heritage misusage. The background of figure 176 is completely occupied with waste dumps, which is another example of shortsightedness, since nature is a human heritage to be preserved and not to be abused.
9.4 UNDERGROUND
Naturally mining is cheaper at the surface than underground. Hence, mining will only go underground if the desired material can no longer be extracted from the surface, or if that material does not outcrop.
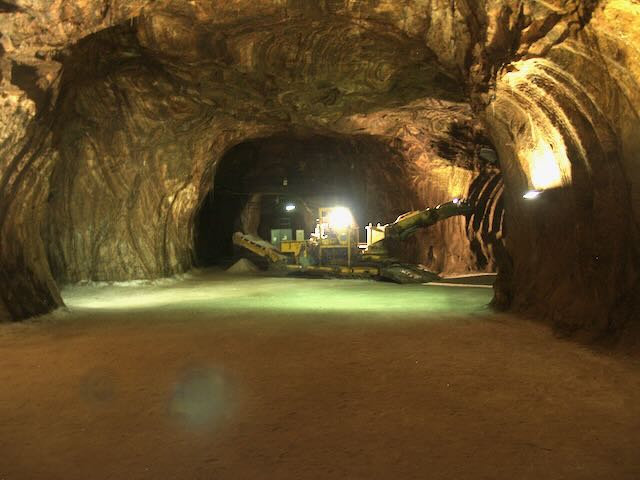
9.4.1 Marble
I visited the quarry/mine shown in figure 177, in November of 1998. It is apparent that the exploitation is still within day light. In fact it is a case of cutting inwards from a central open pit. Going underground reduces the need to remove the thick overburden constituted by very weathered and broken marble, thus reducing waste removal. One can have an idea on how close the surface is, because the weathering effect is still noticeable on the upper section of the central portion, which is a structural support pillar. By the way, this pilar also shows how well the wire cutting mechanism mentioned above works.

Figure 177 – Underground mining of marble (Porto Alegre region, Portugal).
Naturally, as the picture shows, this is a case of very high quality white marble, hence allowing the possibility of going underground. However, even with all these possible cost advantages, I wonder if the venture is still going. I do not have much faith in it.
9.4.2 Rock Salt
Perhaps a rather interesting and important example of early mining underground is rock salt. Obviously outcrops of such a material would not last at all, since salt is so soluble. However, salt diapers (item 6.5.2) are very abundant for example, in Europe, and I’m sure it has been mined since time immemorial, because it was so useful in areas away from the coast, and it is so easily mined (fig. 178).
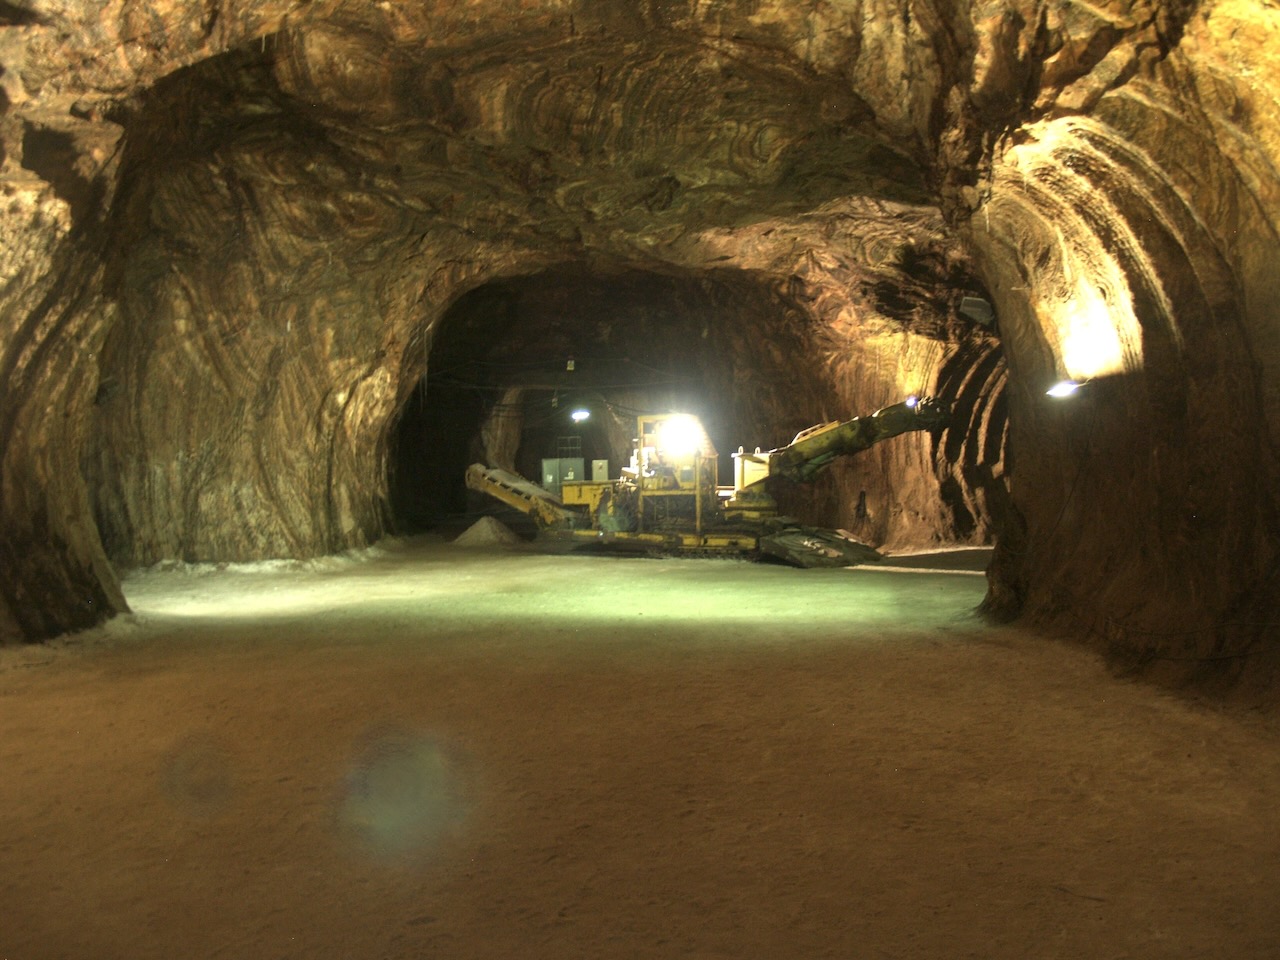
Figure 178 – Mining a rock salt diaper (Loulé, Portugal).
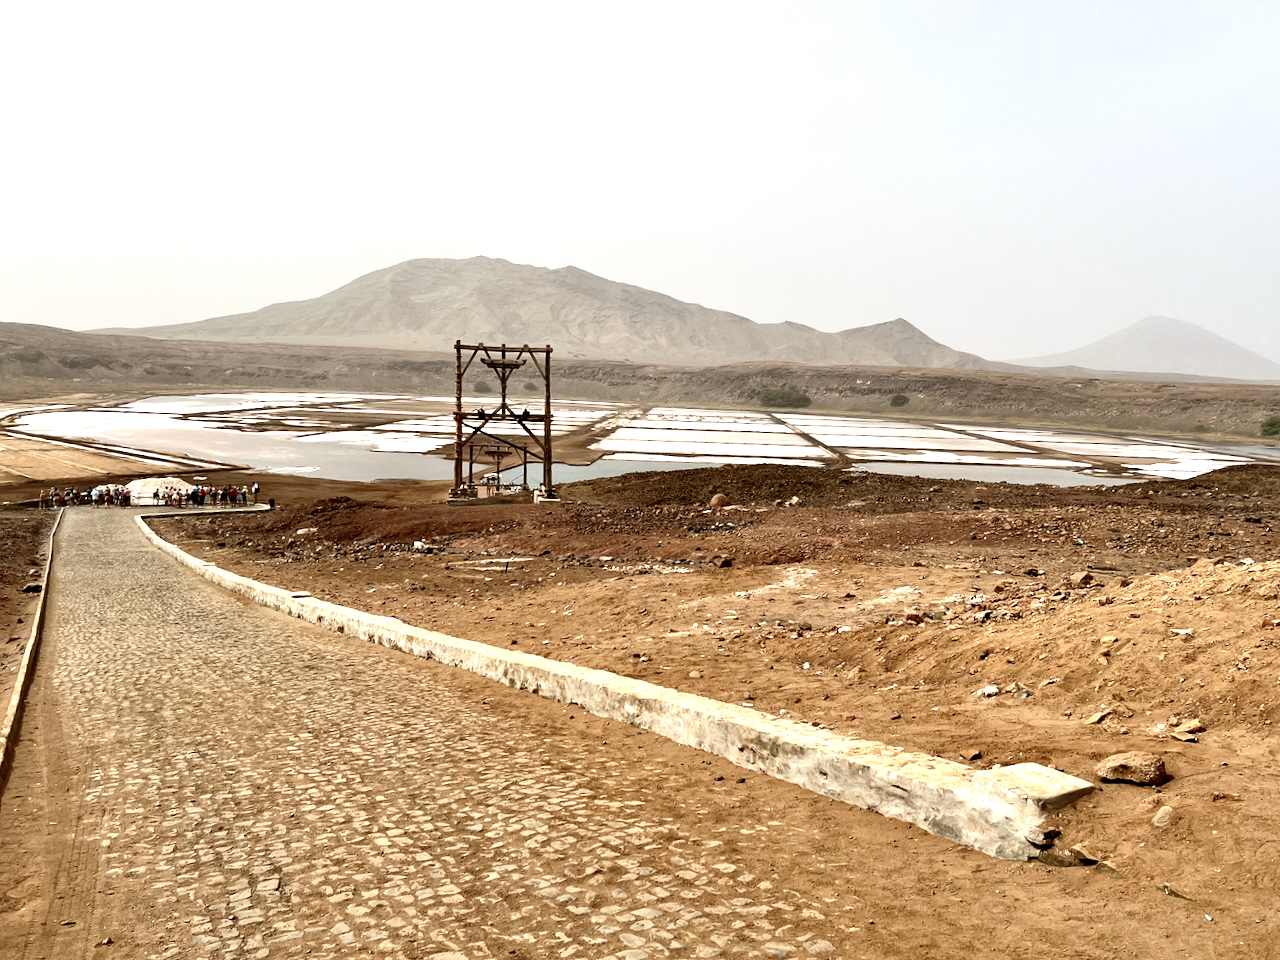
Of these diapers, Portugal has a very unusual example in the vicinity of Rio Maior. Its extraction method is quite unique because that diaper is located in a rather large aquifer within a limestone succession. The water in this aquifer has diluted the rock salt to a concentration seven times greater than the one of the Atlantic Ocean, approximately 30km W of this deposit. Thus, instead of having to mine the rock salt underground, the saturated water is simply drawn from a well (fig. 178B),
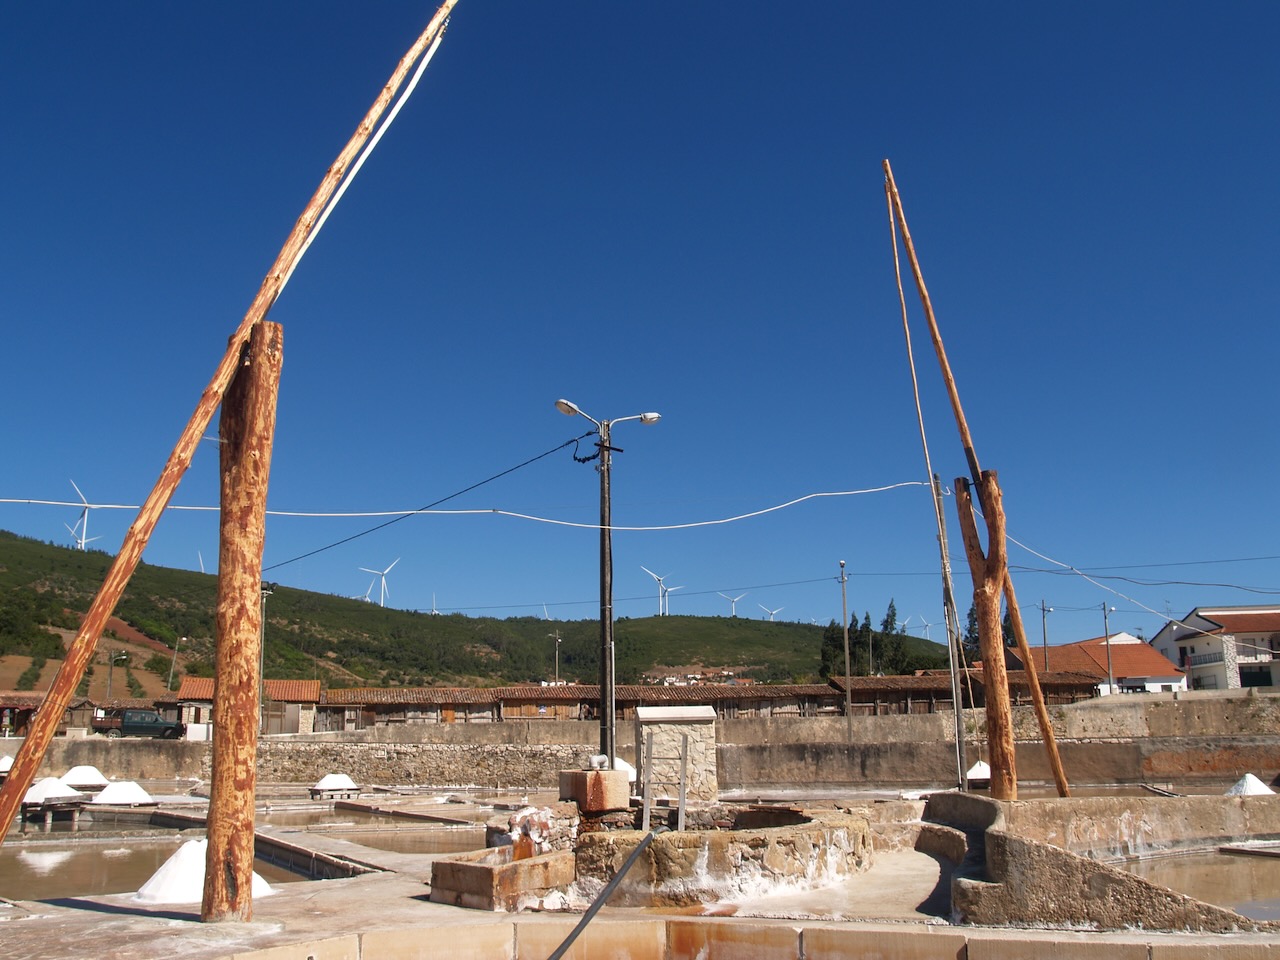
Figure 178B – Rock salt extraction (Rio Maior, Portugal).
and the much cleaner salt is collected from the evaporation pans around it (fig. 178C). Supposedly this deposit has been exploited on and off since 1177.
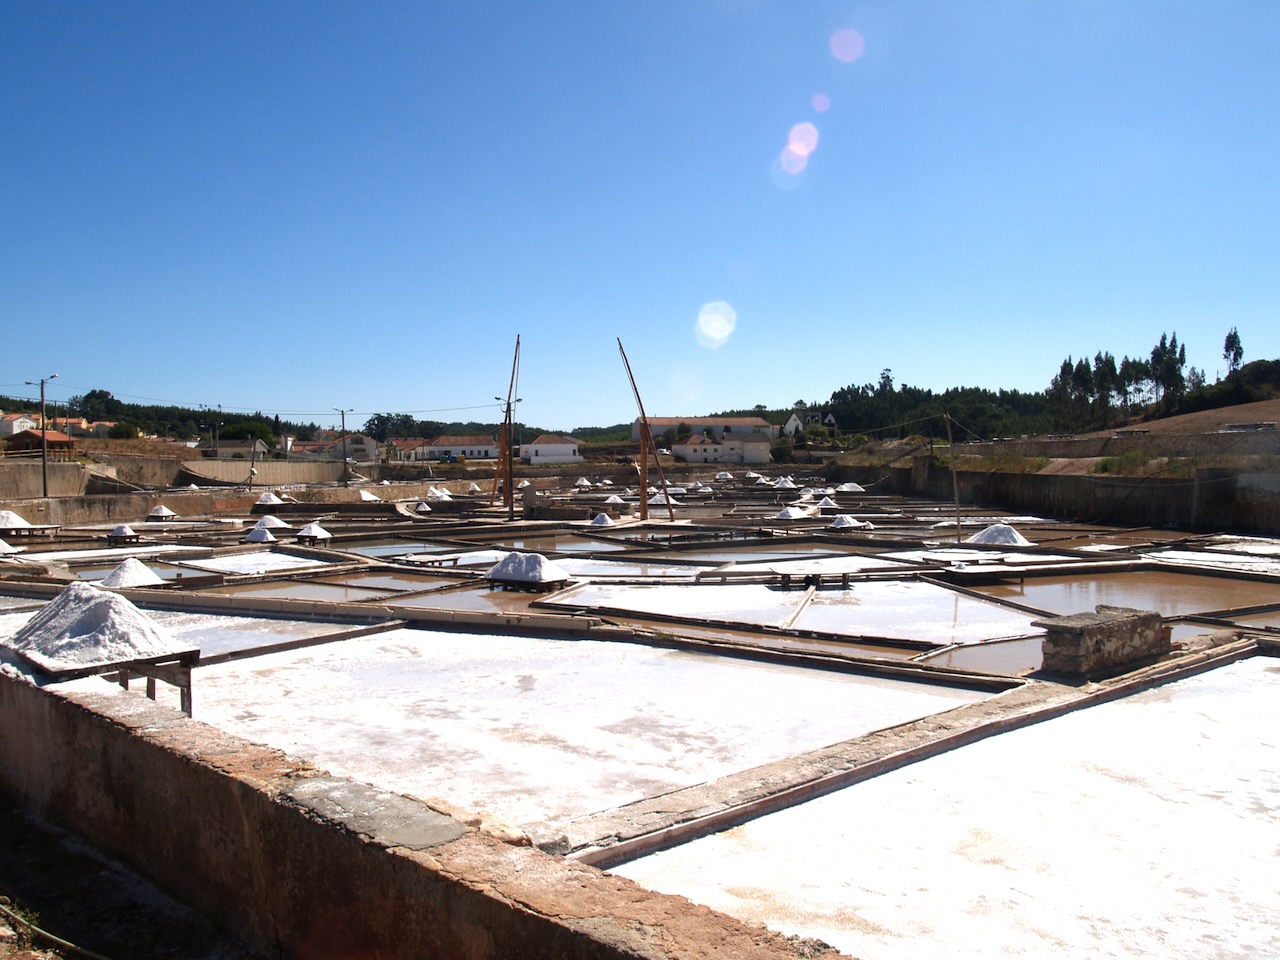
Figure 178C – The salt pans around the well.
9.4.3 Chrome
The chrome mine at Boula, India, is a good example of a mine which started at the surface, but due to the space constraints with depth, it had to opt and go underground (fig. 179).
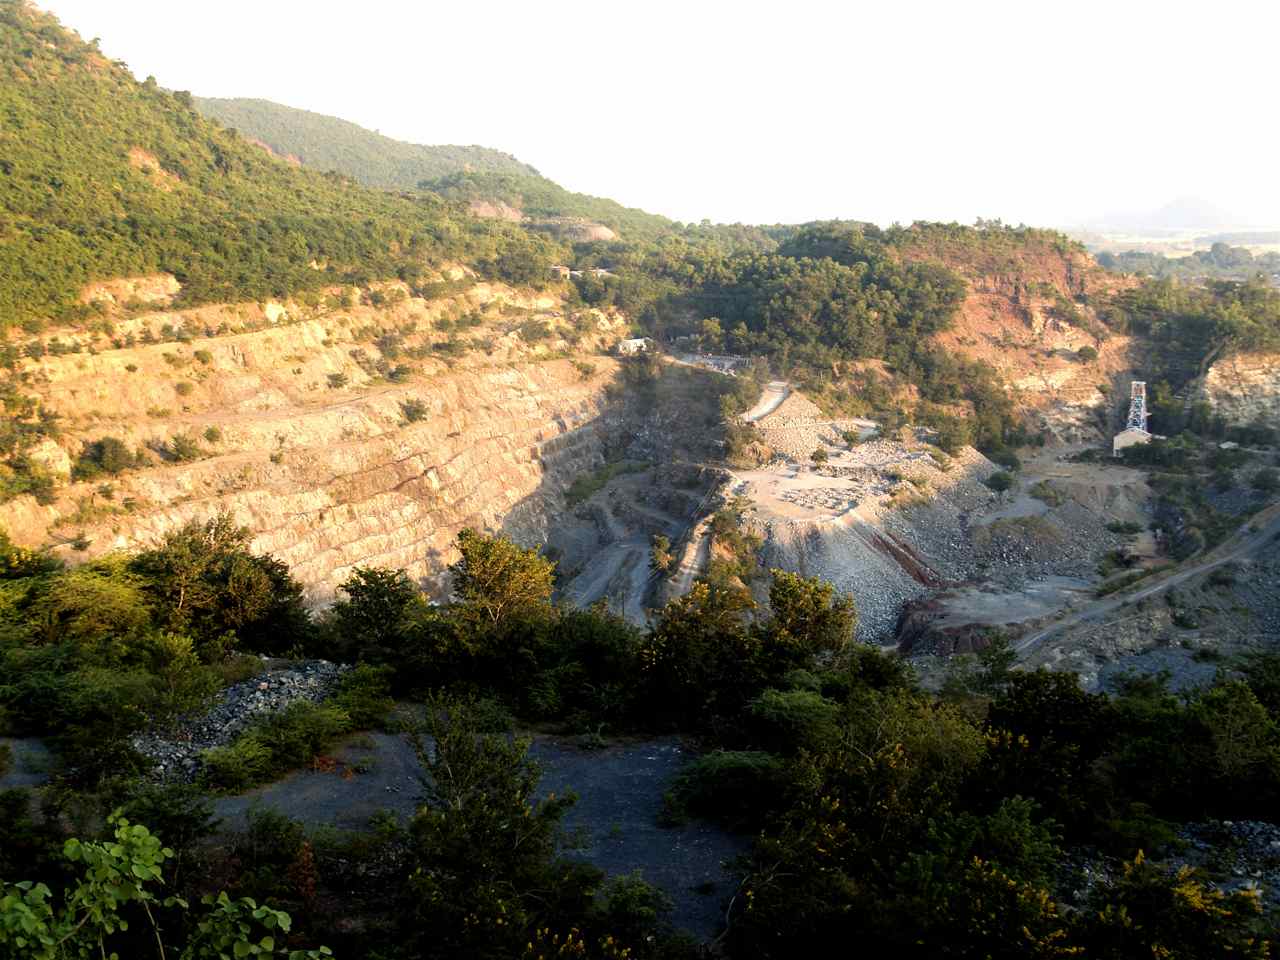
Figure 179 – Boula chrome mine (Orissa, India).
Three chrome rich zones exist in this mine. The richest, originally mined at the pit on the left, is named Shankar. To the right within a shallower pit, is the next chrome rich zone, named Lakshmi and to the right of that, outside of the picture, there is the third chrome rich zone named Durga. The Shankar section is the deepest portion of the open cast development, at the far end of which the small little building is the engine house for the hauling of ore along an inclined shaft. On the right, within the Lakshmi pit we have the more obvious headgear of a vertical shaft. It is via these two shafts that the underground mining is done. This mine has interesting features which deserve mentioning. Notice at the centre, of picture 179, the flat portion at the higher point separating the Shankar from the Lakshmi pits. That is where the ore is sorted (fig. 180)

Figure 180 – Hand ore sorting (Chrome mine, Boula, India).
and piled (fig. 181). Female laborers do the sorting by hand and they are also the ones who, manually and meticulously, pack the ore on an exactly dimensioned four sided prism. This is a natural consequence of cheap labour. Note that a mechanical ore sorting machine would be far too expensive, making this venture not viable. In the same way, the packed ore does not need to be weighed, saving on the expense of such a machine. The volume of the prism is measured by tape and the tonnage is calculated using the predetermined SG of the packed ore.

Figure 181 – Manually packed ore pile (Chrome mine, Boula, India).
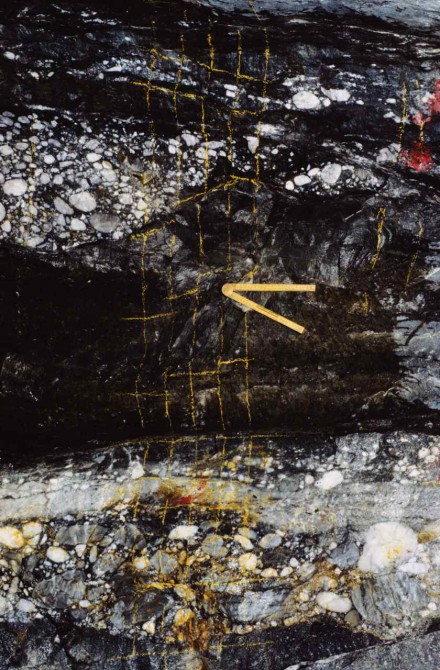
Now, the naming of the ore zones; figure 179 is facing S and the picture was taken from a ridge formed by a fault zone with an apparent uplift to the N. On the N side of the fault, that is, behind the photographer, only one ore zone exists which was named Ganga. I find the reasoning behind the naming fascinating. If I understood it correctly, Shankar is a very important god whose wife is Lakshmi and they have a daughter called Durga. In other words, the thickest and best developed ore zone gets the name of an important god. Next to it but not as well developed, is his wife and the weakest of the ore zones is the daughter. More, supposedly Ganga is Shankar’s lover. The affair must not be obvious so Ganga is separated by a fault, but she is important and so she is at a higher level than Lakshmi and Durga.
9.4.4 Diamond Pipe
The Kimberly pipe (fig. 17 ) is the one which started the diamond rush in South Africa and gave the name to the rock that forms it (kimberlite). This is another example of surface mining having to go underground due to lack of space. By 1875, within the 38 acres encompassing the outcrop area of the pipe, there were hundreds of independent miners working in their separate claims as can be observed in figure 181B, showing not only the web made by the numerous cables of the active individual rock hoists, but also the depth at which they were already working.

Figure 181B – The historic Kimberley Pipe in South Africa. Photo taken in 1875, showing the existing individual rock hoists (photo obtained in the Kimberley Museum “sold in the aid of the Red Cross”).
The corresponding statistics shown in figure 182, gives a rather nice summary.

Figure 182 – Diagrammatic section and statistics of the Kimberley diamond pipe (South Africa).
9.4.5 Witwatersrand
I think this is the best example of the influence of mining on the surface morphology and on the important differences between surface and underground mining. Figure 183 shows Johannesburg from the air, seen from the South. Notice in the background numerous large buildings. In the mid ground, with practically no buildings, there is a reasonably sized lake and two barren portions, one close to the left extremity, which is a remaining waste dump and the other of considerably larger dimension, near to the lake is a slimes (tailings) dam. This central area is where the gold bearing sedimentary horizons of the Witwatersrand Supergroup outcrop and most of that ground still belonged to the mining houses in 1984, when this picture was taken.

Figure 183 – Johannesburg from the air (South Africa).
These gold bearing sediments dip southwards at about 25º and the mining started going underground by about where the lake is. In other words, the houses in the foreground of the picture were built over ground mined pretty close to the surface. That is why, by municipal law, no houses of more than one floor were allowed on that sector. Nowadays all the Witwatersrand gold mines are underground and their head gears are characteristic of the region (fig. 184).

Figure 184 – Winklehaak Gold Mine no 1 shaft and reduction works, Evander, SA.
The haulage levels are approximately 30 vertical metres apart and the staff as well as the materials are transported by very fast lifts with stations at every level (fig. 185).

Figure 185 – Underground lift station, East Driefontein Gold Mine (Carletonville South Africa).
All the development of the haulages used to be done by drilling and blasting (fig. 186),

Figure 186- Underground drilling team (East Driefontein Gold Mine, Carletonville South Africa).
but by the time I left, 1975, boring machines were starting to be used in main haulages and raises (fig. 187).

Figure 187 – Raise borer hole (East Driefontein Gold Mine, Carletonville South Africa).
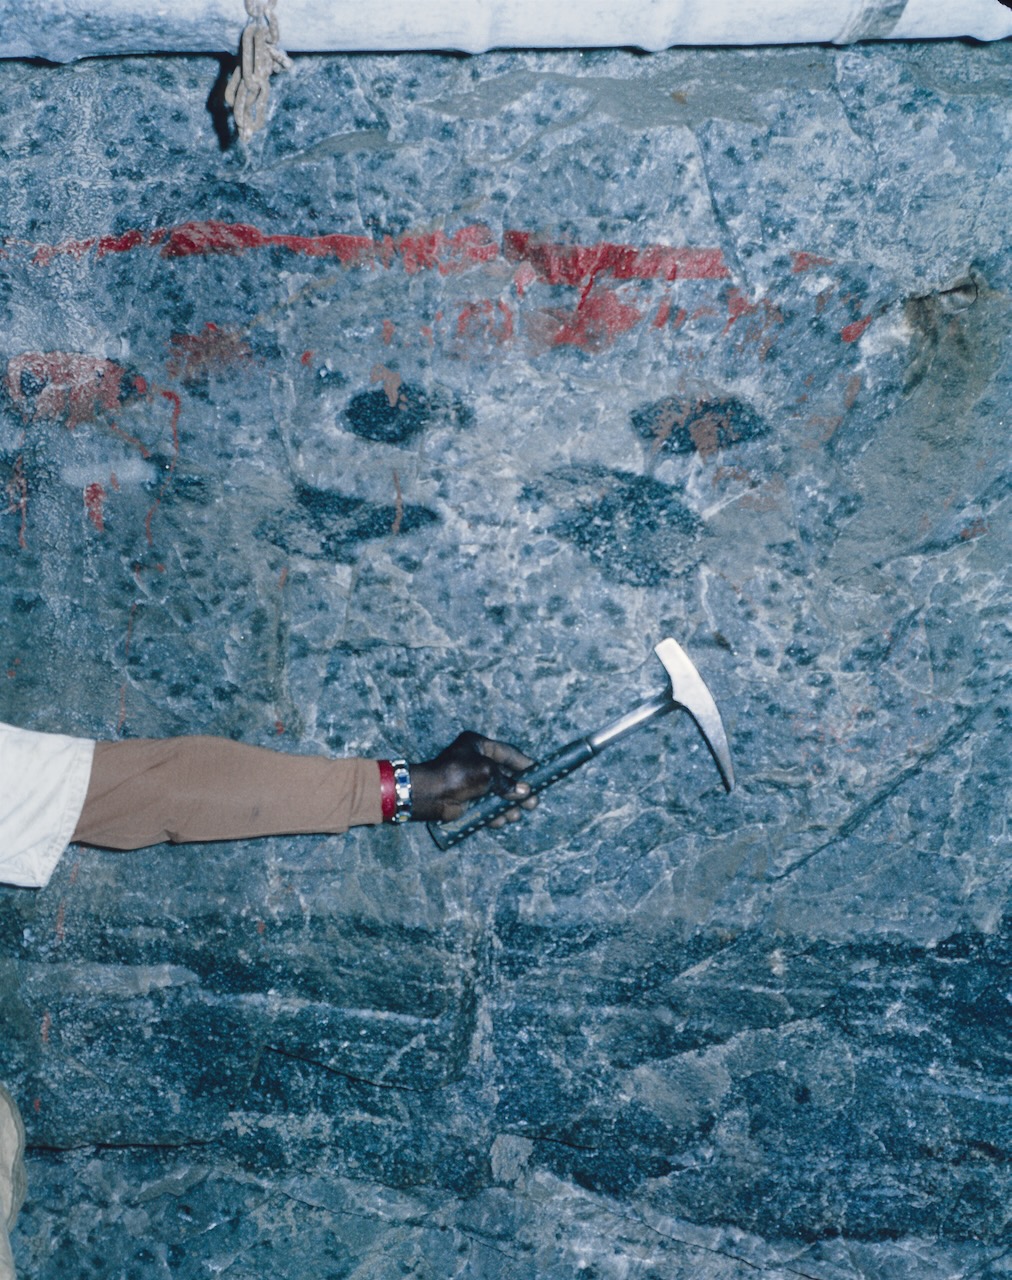
Stopes are the section of the mine from where the ore is extracted. Since we are dealing with a sedimentary horizon, mine-wise speaking, it has a limited thickness but an unlimited length and width. Thus, wherever the grade is economical that layer of the rock sequence is entirely removed. Figure 188 shows a stope face with the ore exposed.

Figure 188 – Stope face (East Driefontein Gold Mine, Carletonville South Africa).
To use rock pillars, is to reduce the amount of extractable ore. Thus they used wood log mats (fig. 189). The picture shows two pillars already in place and in the middle a loose pile of mats.

Figure 189 – Sotpe pillar support (East Driefontein Gold Mine, Carletonville South Africa).
Finally, observation of my assistant, Zé (fig. 188), shows how hot it is in those mines. This picture was taken at about 1800m below surface and the rock temperature was close to 50ºC. Work is only possible because the ventilation is refrigerated.
10 Rehabilitation
As mentioned above, we should not abuse of what nature gives us, and it is our duty to rehabilitate the places destroyed by exploitation. In fact, this is a subject of grate importance, requiring a particularly detailed study. However, I know far too little about it, and all I dare to do here, is give a very brief introduction.
For underground mines, the only example I have is the Witwatersrand gold mines in South Africa (item 9.4.5), where what comes to the surface, is the waste rock, deposited in dumps, and the ore, which is crushed to a very fine mesh, the gold is removed using cyanide, and what remains, a very fine grained sterile mush, is deposited in slimes dams. The waste rock consists of very hard quartzite, and that is reprocessed as gravel for construction. However, the rehabilitation of the slimes dams was much more complex. The slimes dry to a fine dust which, on windy days used to cover the nearby houses. Eventually, the solution encountered was to cover those dams with thick layers of fertile soil and vegetate them as quickly as possible.
Regarding open cast mining, many of the times it is nature that has to do most of the work, because the quarries tend to simply be abandoned (fig. 190),
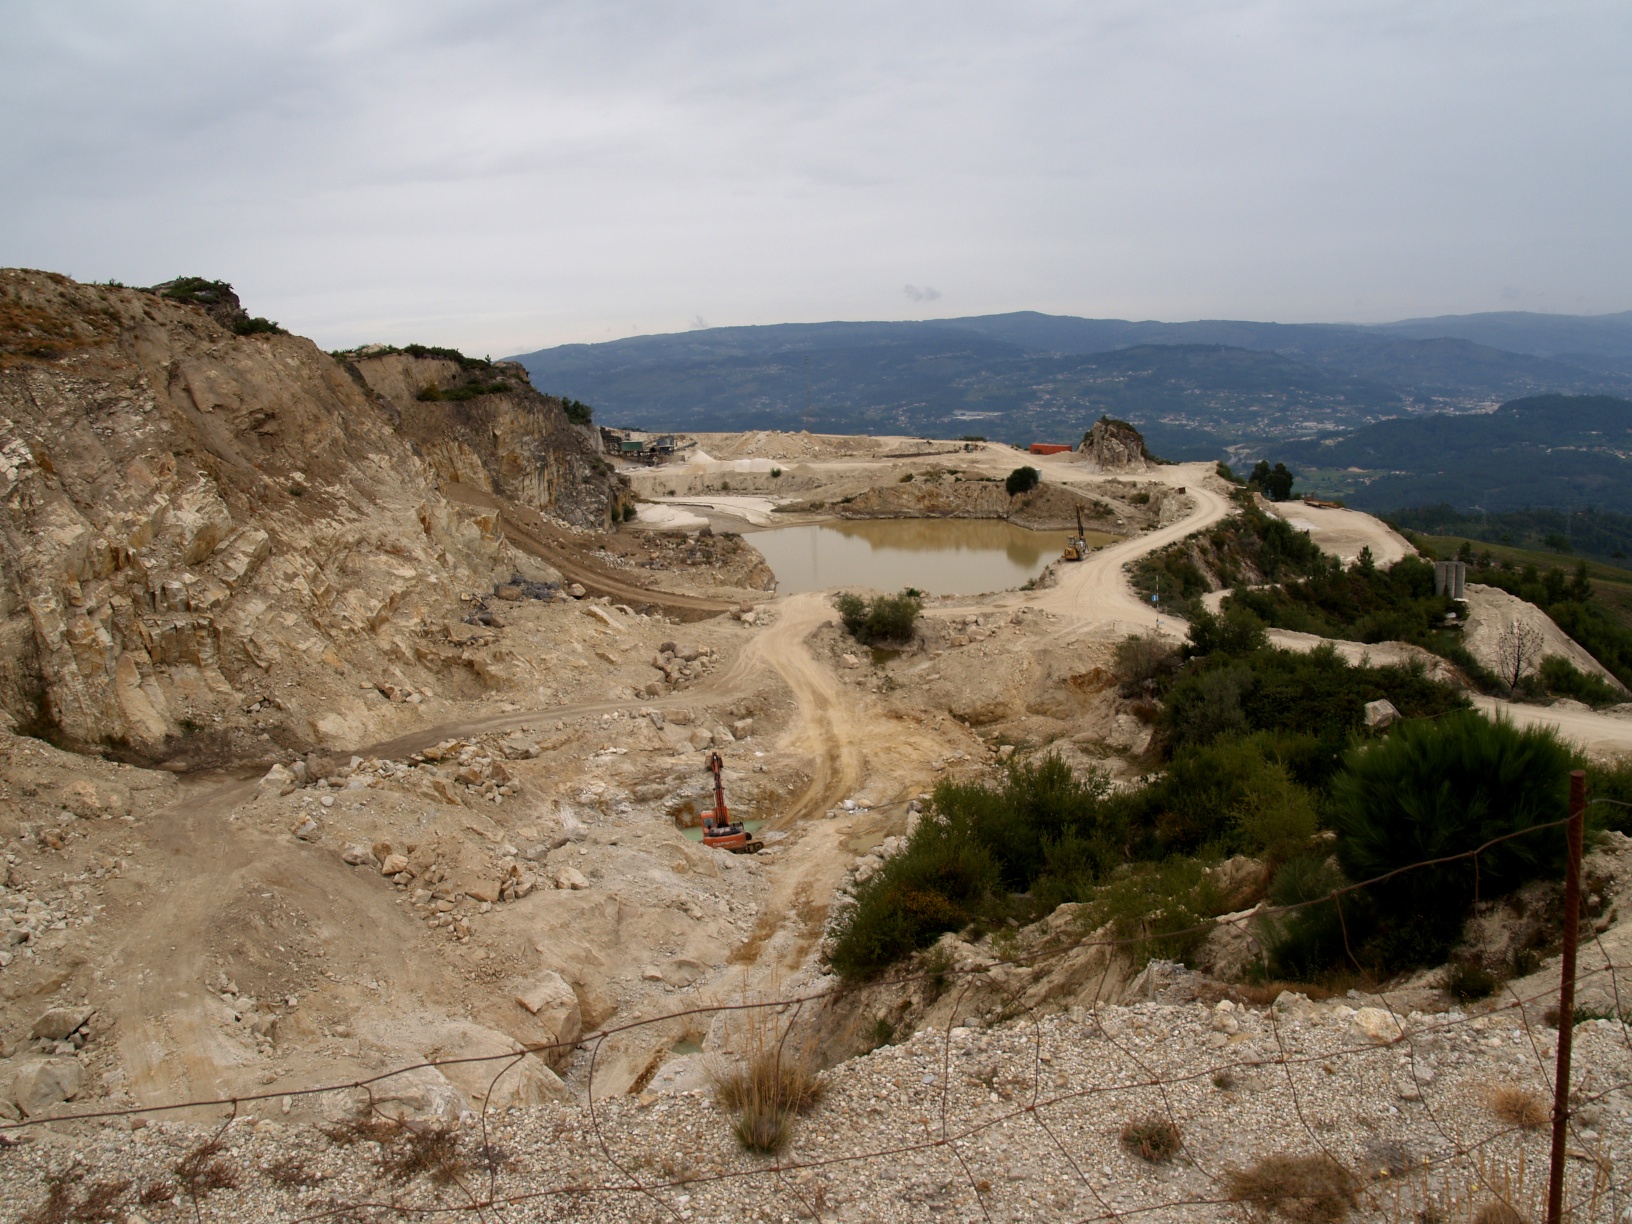
Figure 190 – Abandoned granite pegmatite quarry (Azias, Portugal)
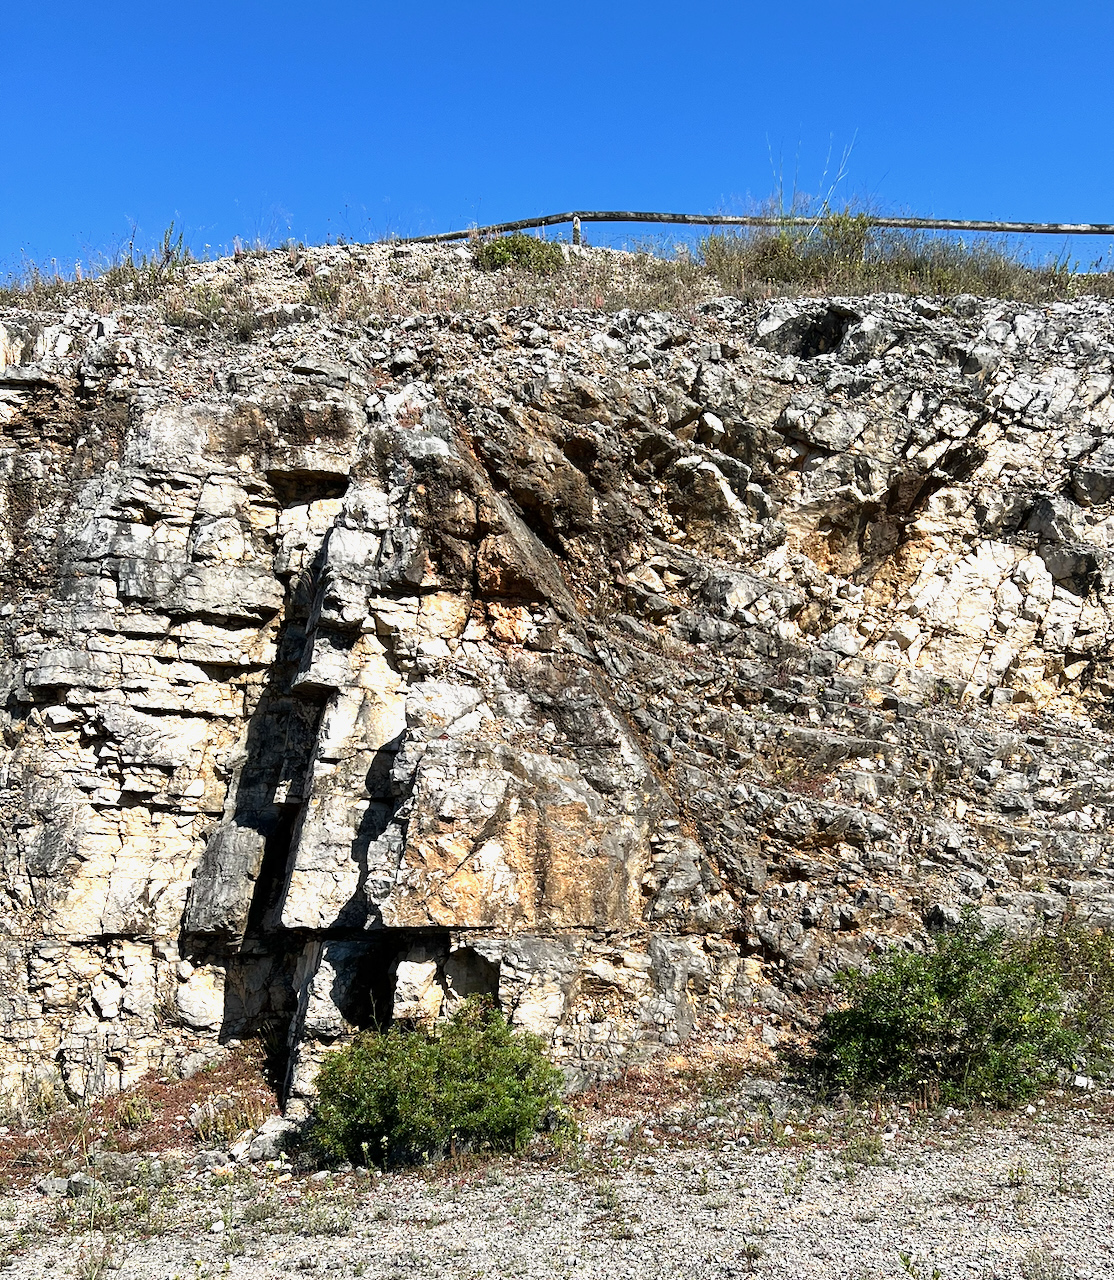
or the area is merely fenced off, when the site is within an inhabited area (fig. 191). Fortunately nature is very resilient and recovers quite well, but it is a very slow process.
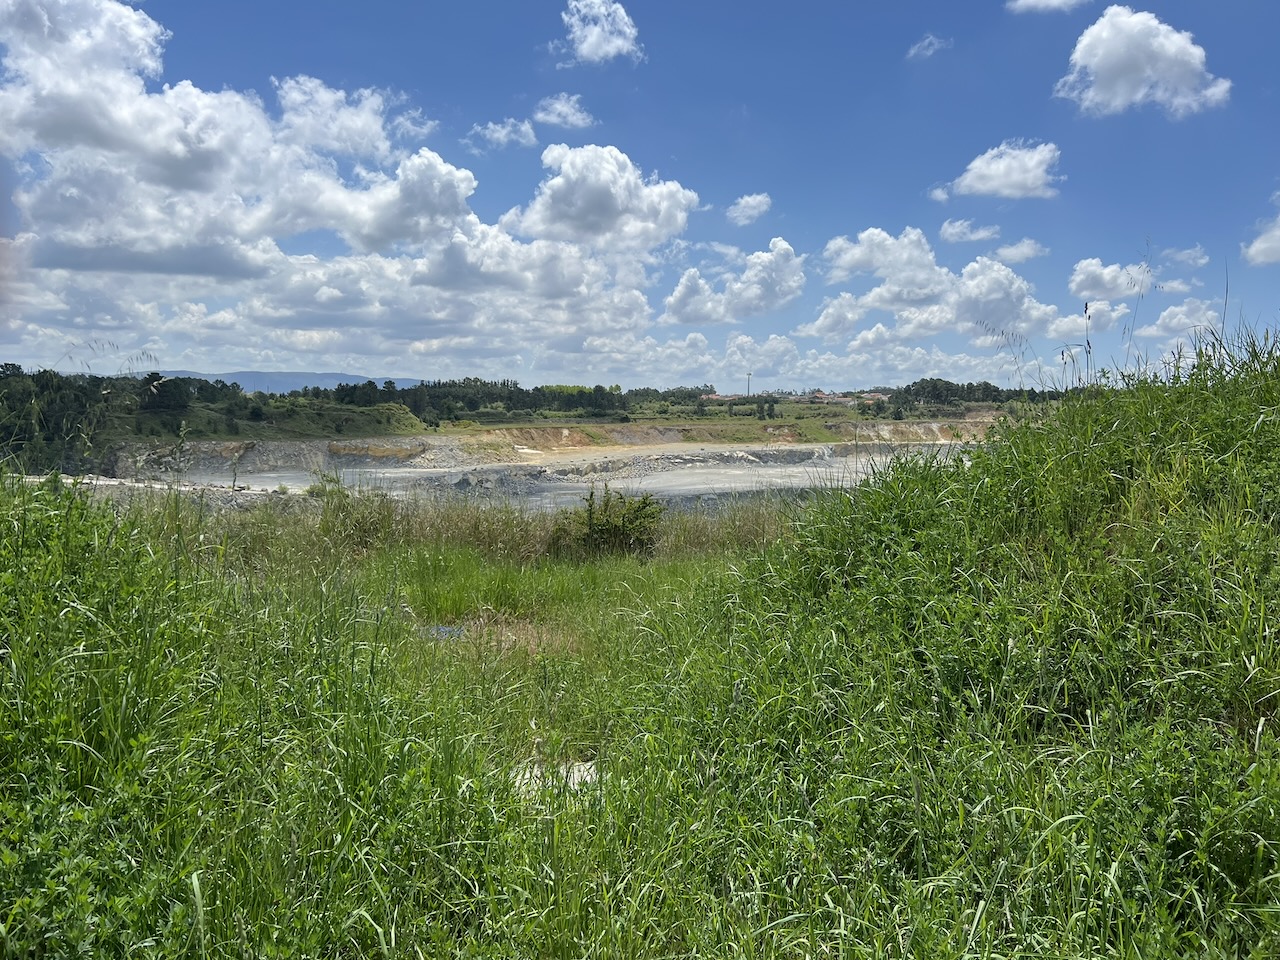
Figure 191 – Fenced off abandoned limestone quarry within the town of Maceira (Portugal).
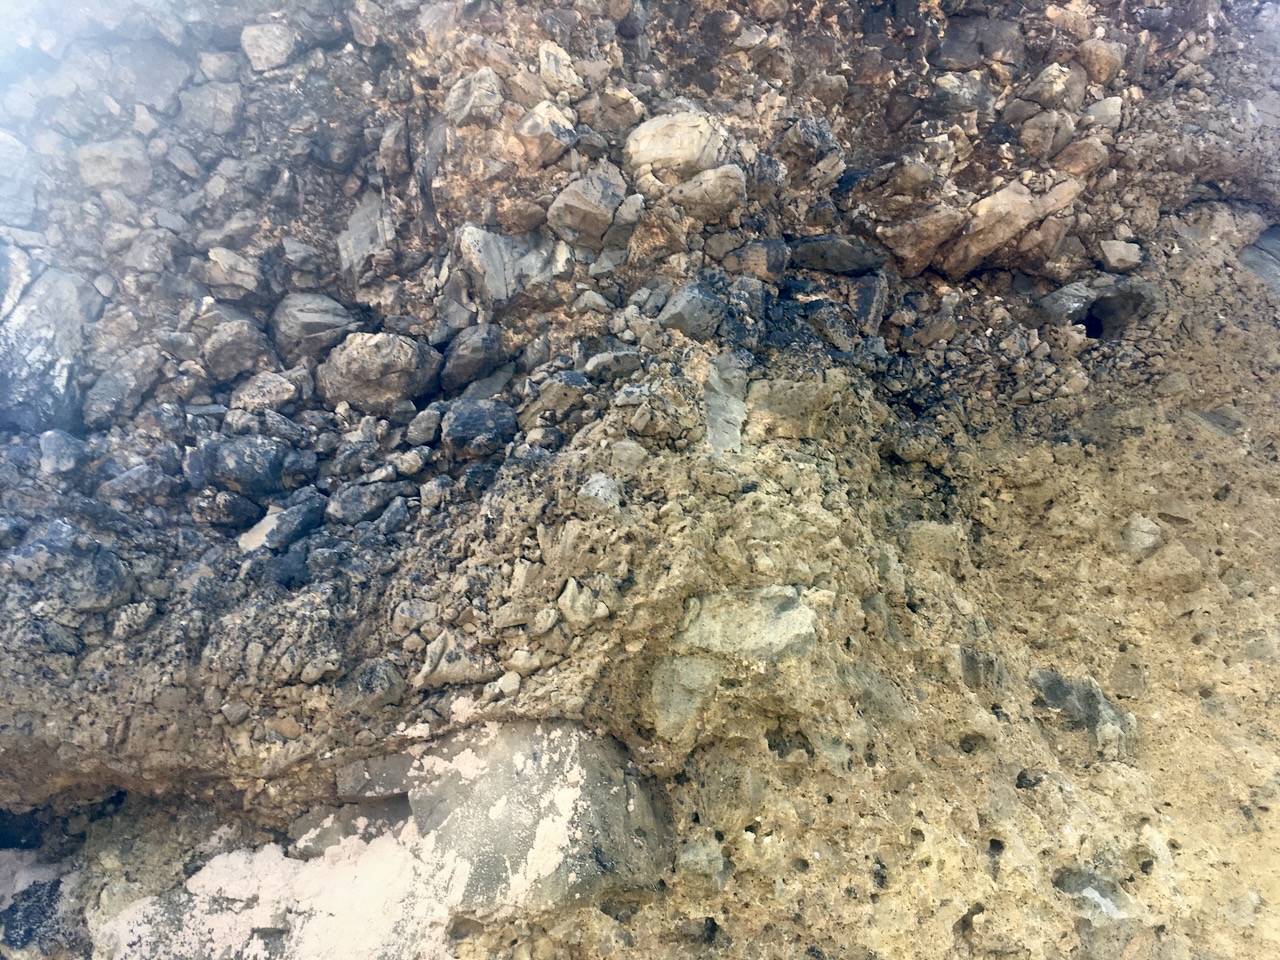
However, in the case of sulphide ores, rehabilitation becomes much more complex because the oxidation of the sulphides (fig. 192),
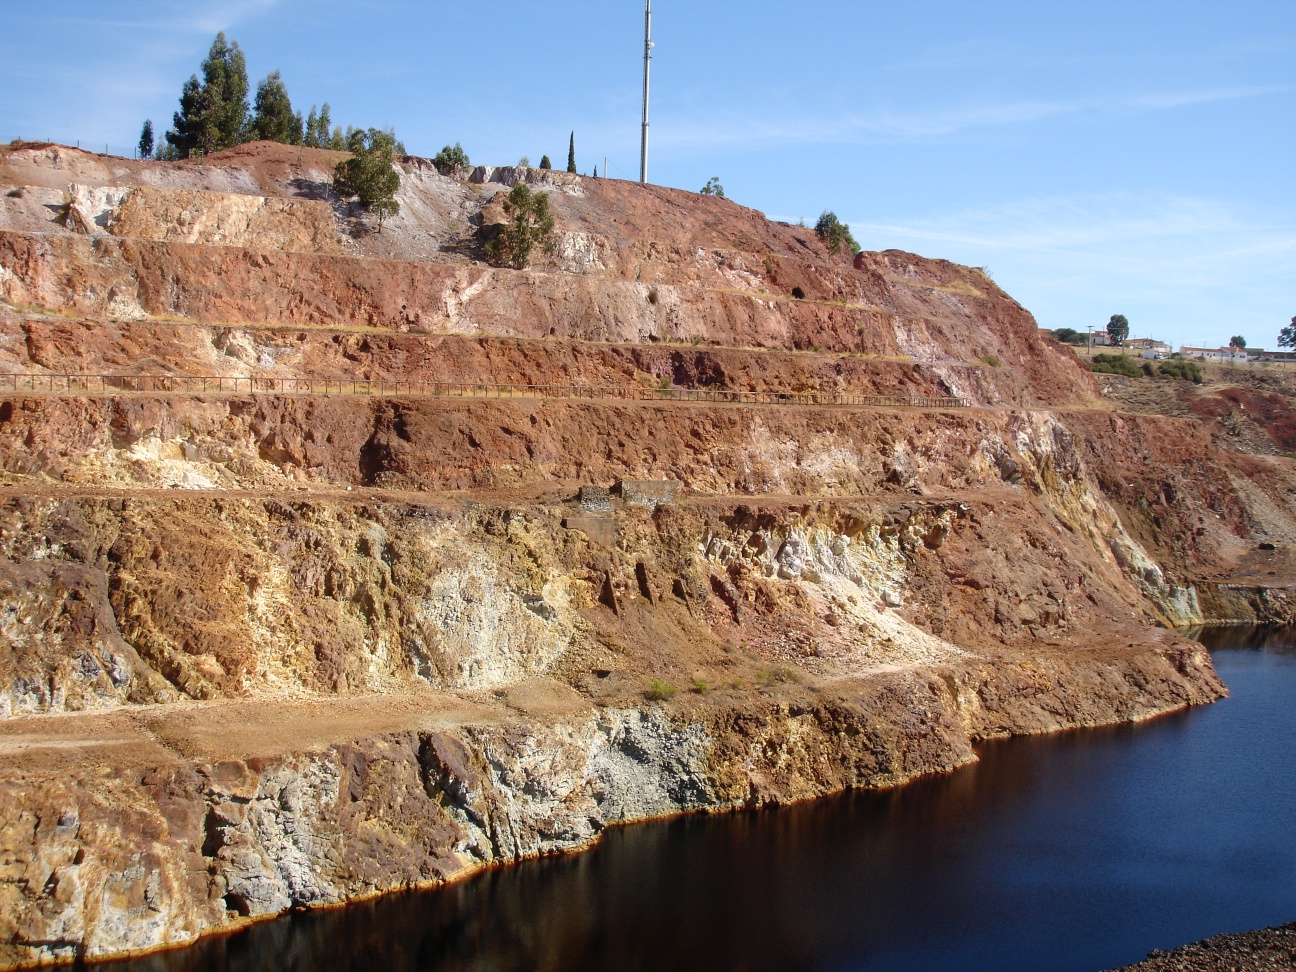
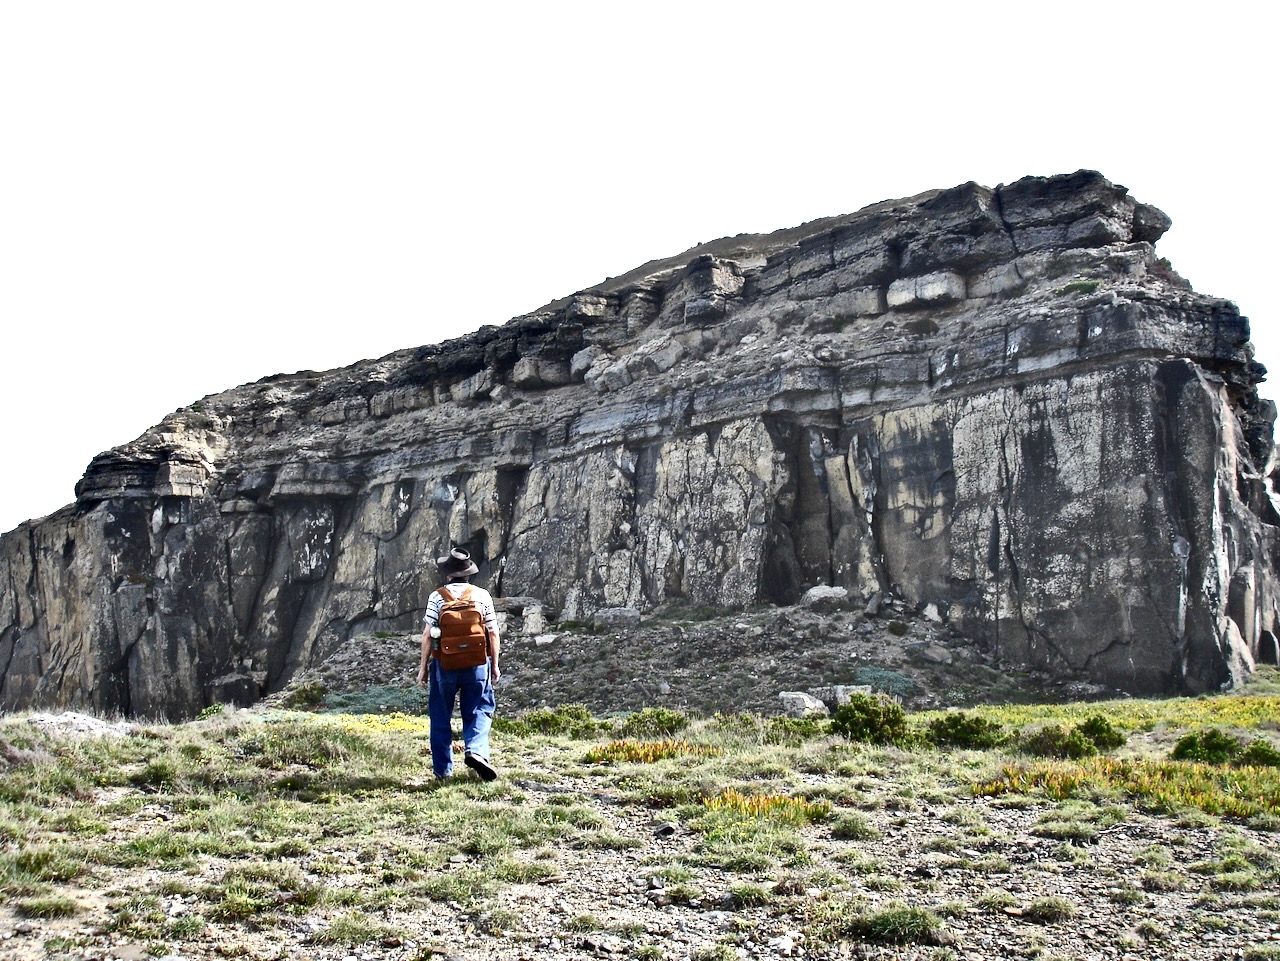
Figure 192 – S. Domingos Copper Mine, Portugal – One of the pit’s faces.
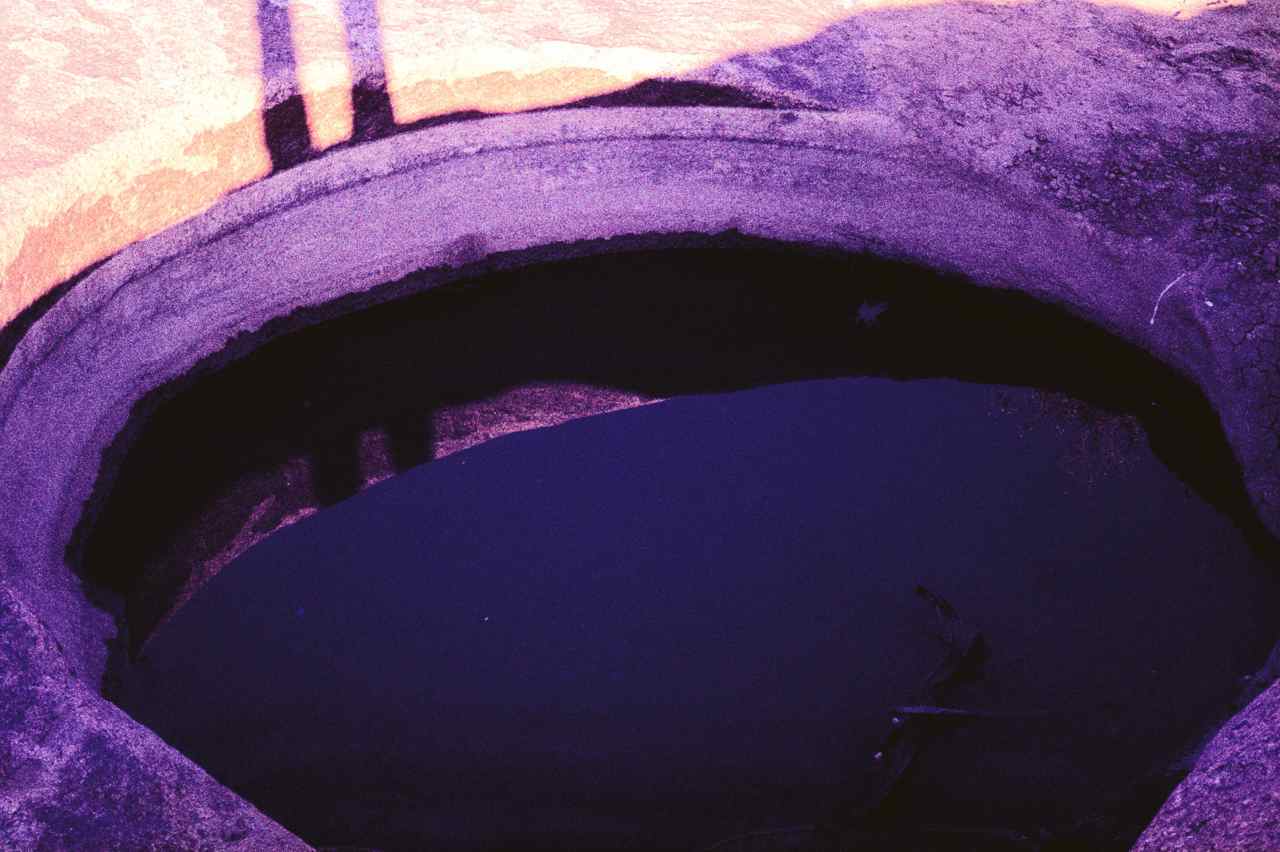
makes the water acidic (fig. 193), completely inhibiting the growth of vegetation. The example I show is of a very small open pit copper mine in Portugal, which ceased its work in 1965, and as can be seen in figure 192 taken in 2010, there are no signs of any vegetation whatsoever. Worst still, these sulphide open pit mines tend to be very large indeed, and it must be incredibly difficult to rehabilitate them.
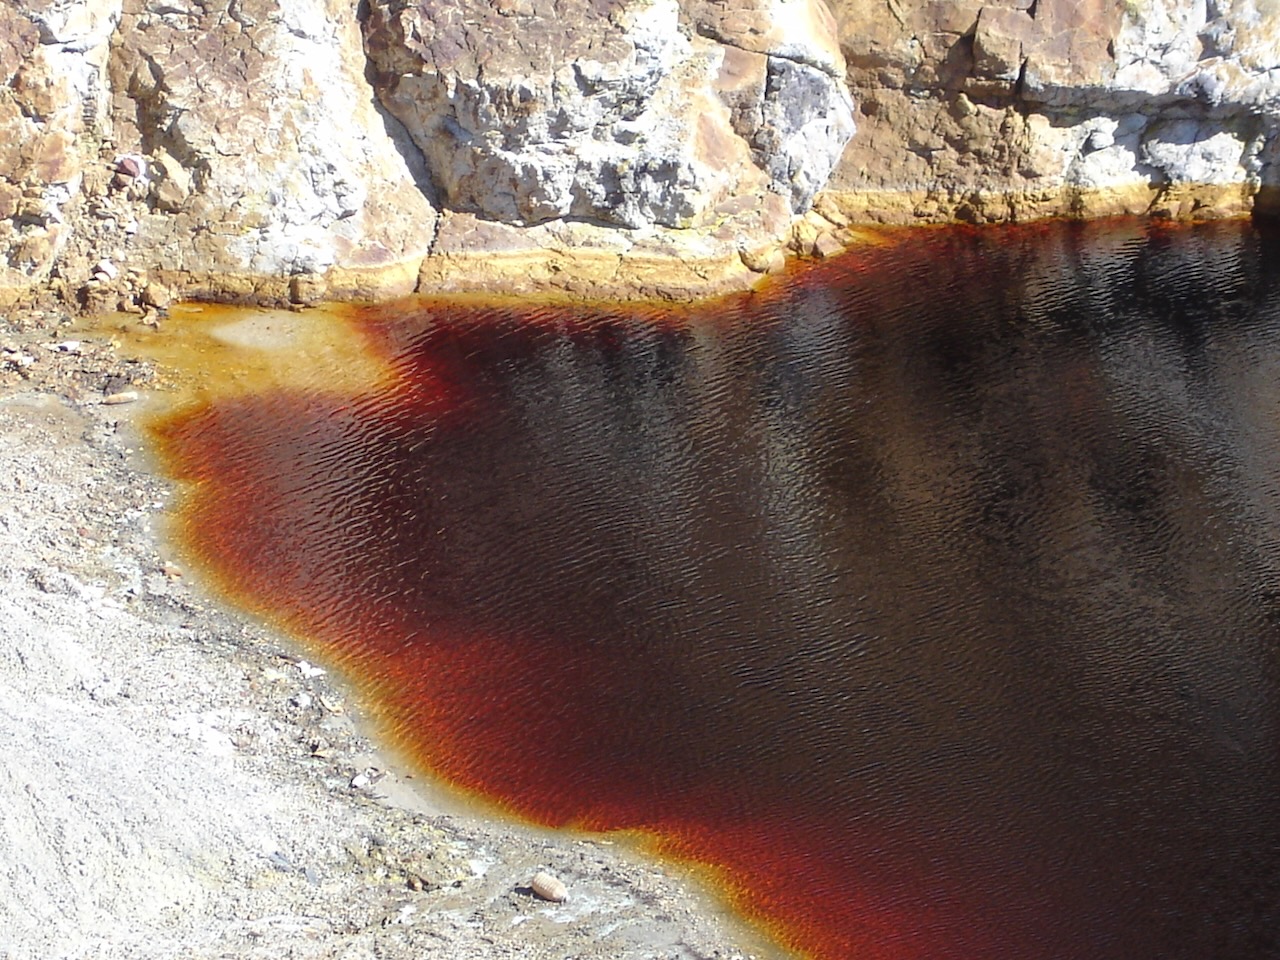
Figure 193 – S. Domingos Copper Mine, Portugal – The water at the bottom of the pit.
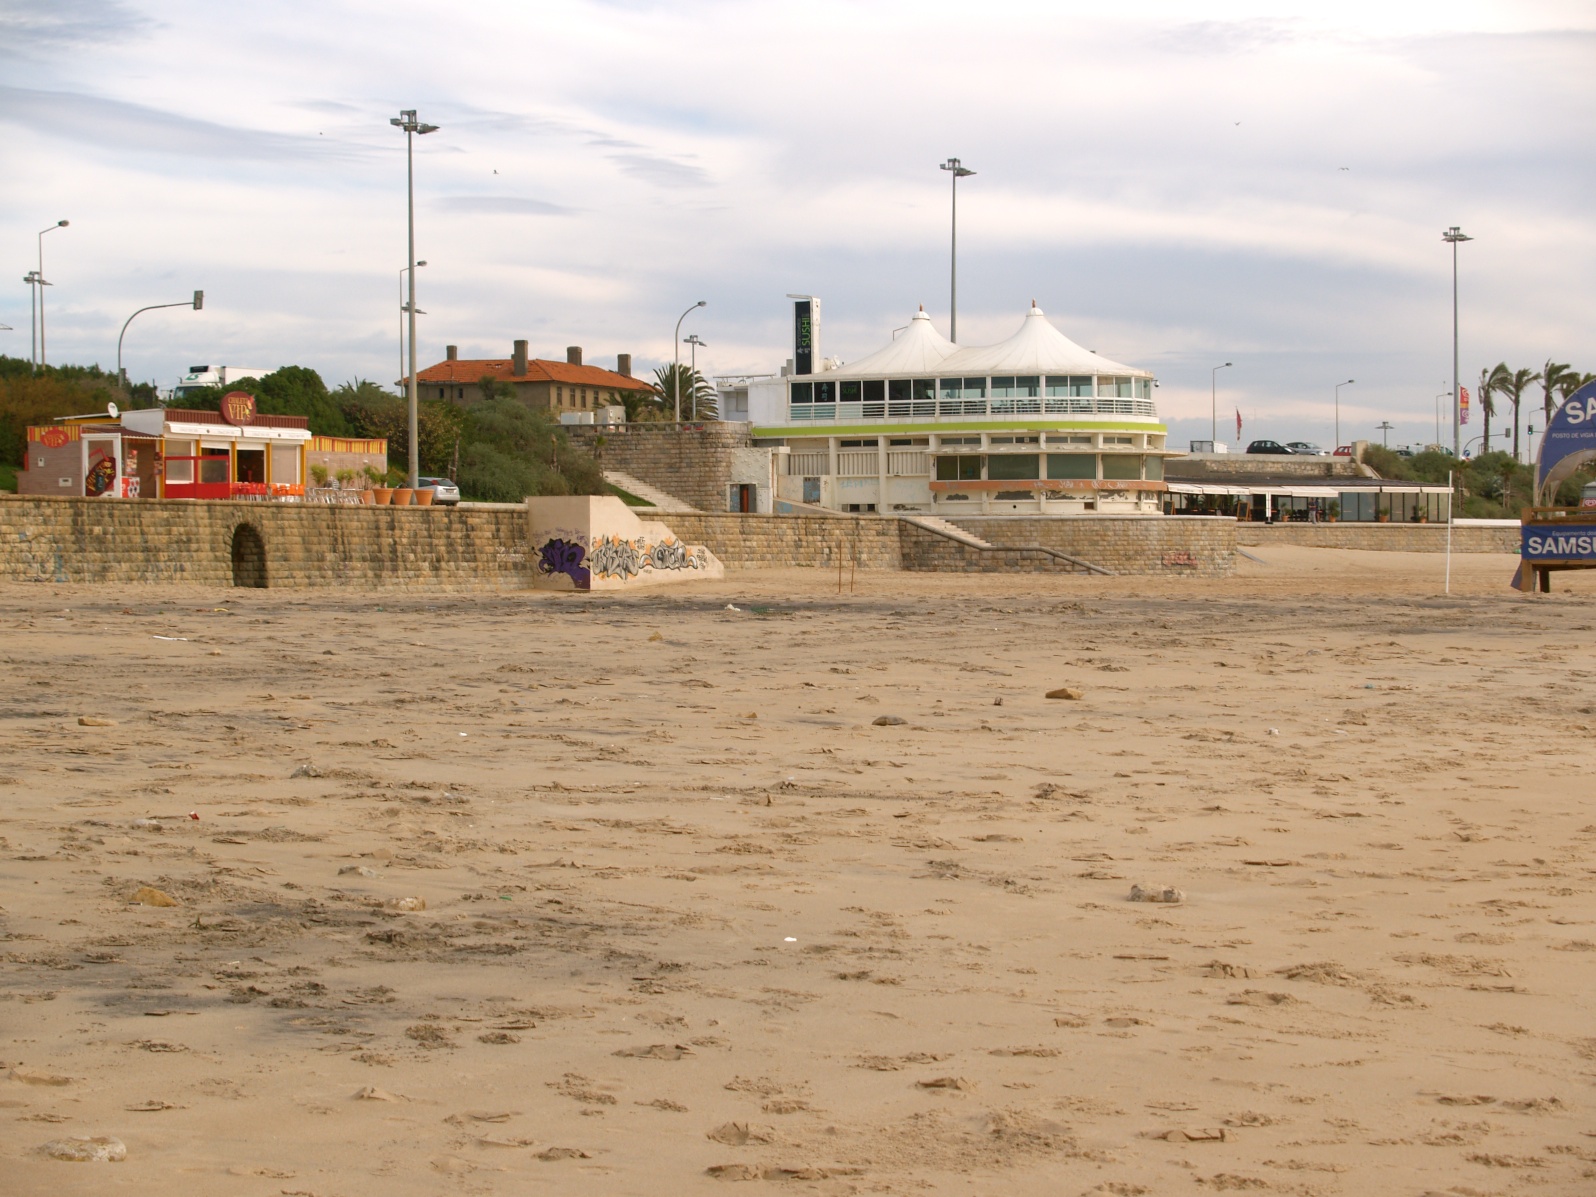
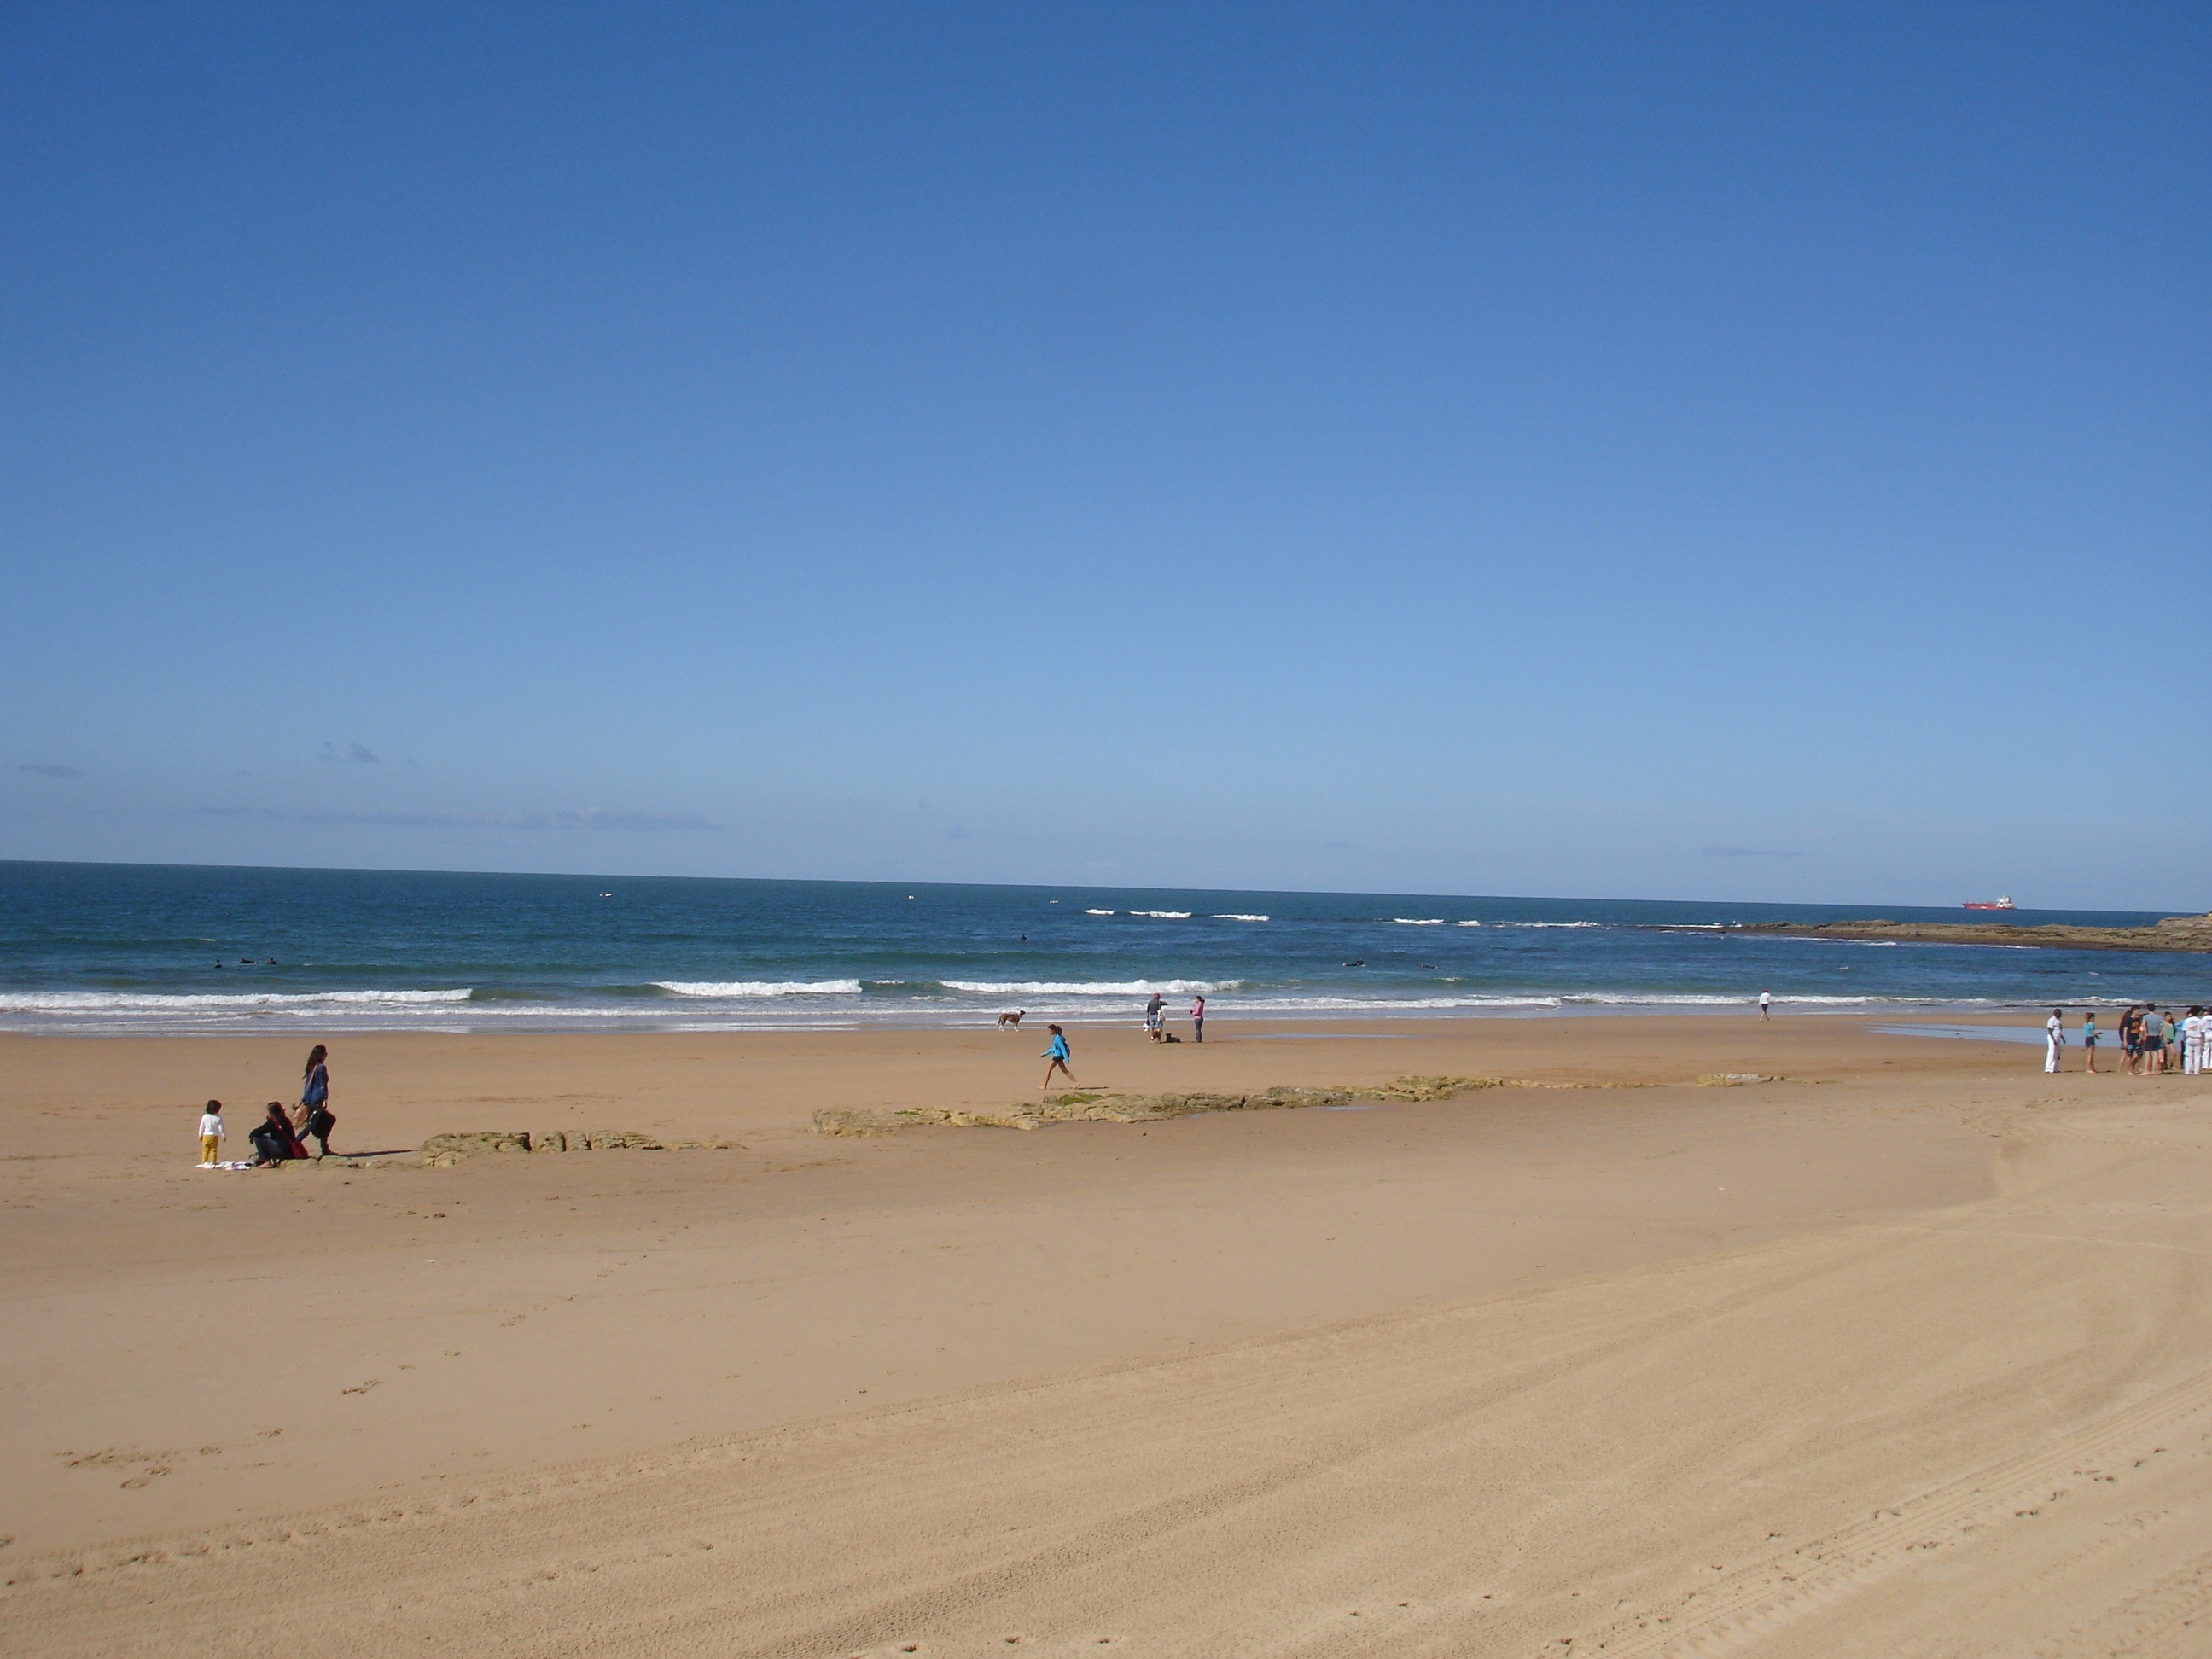
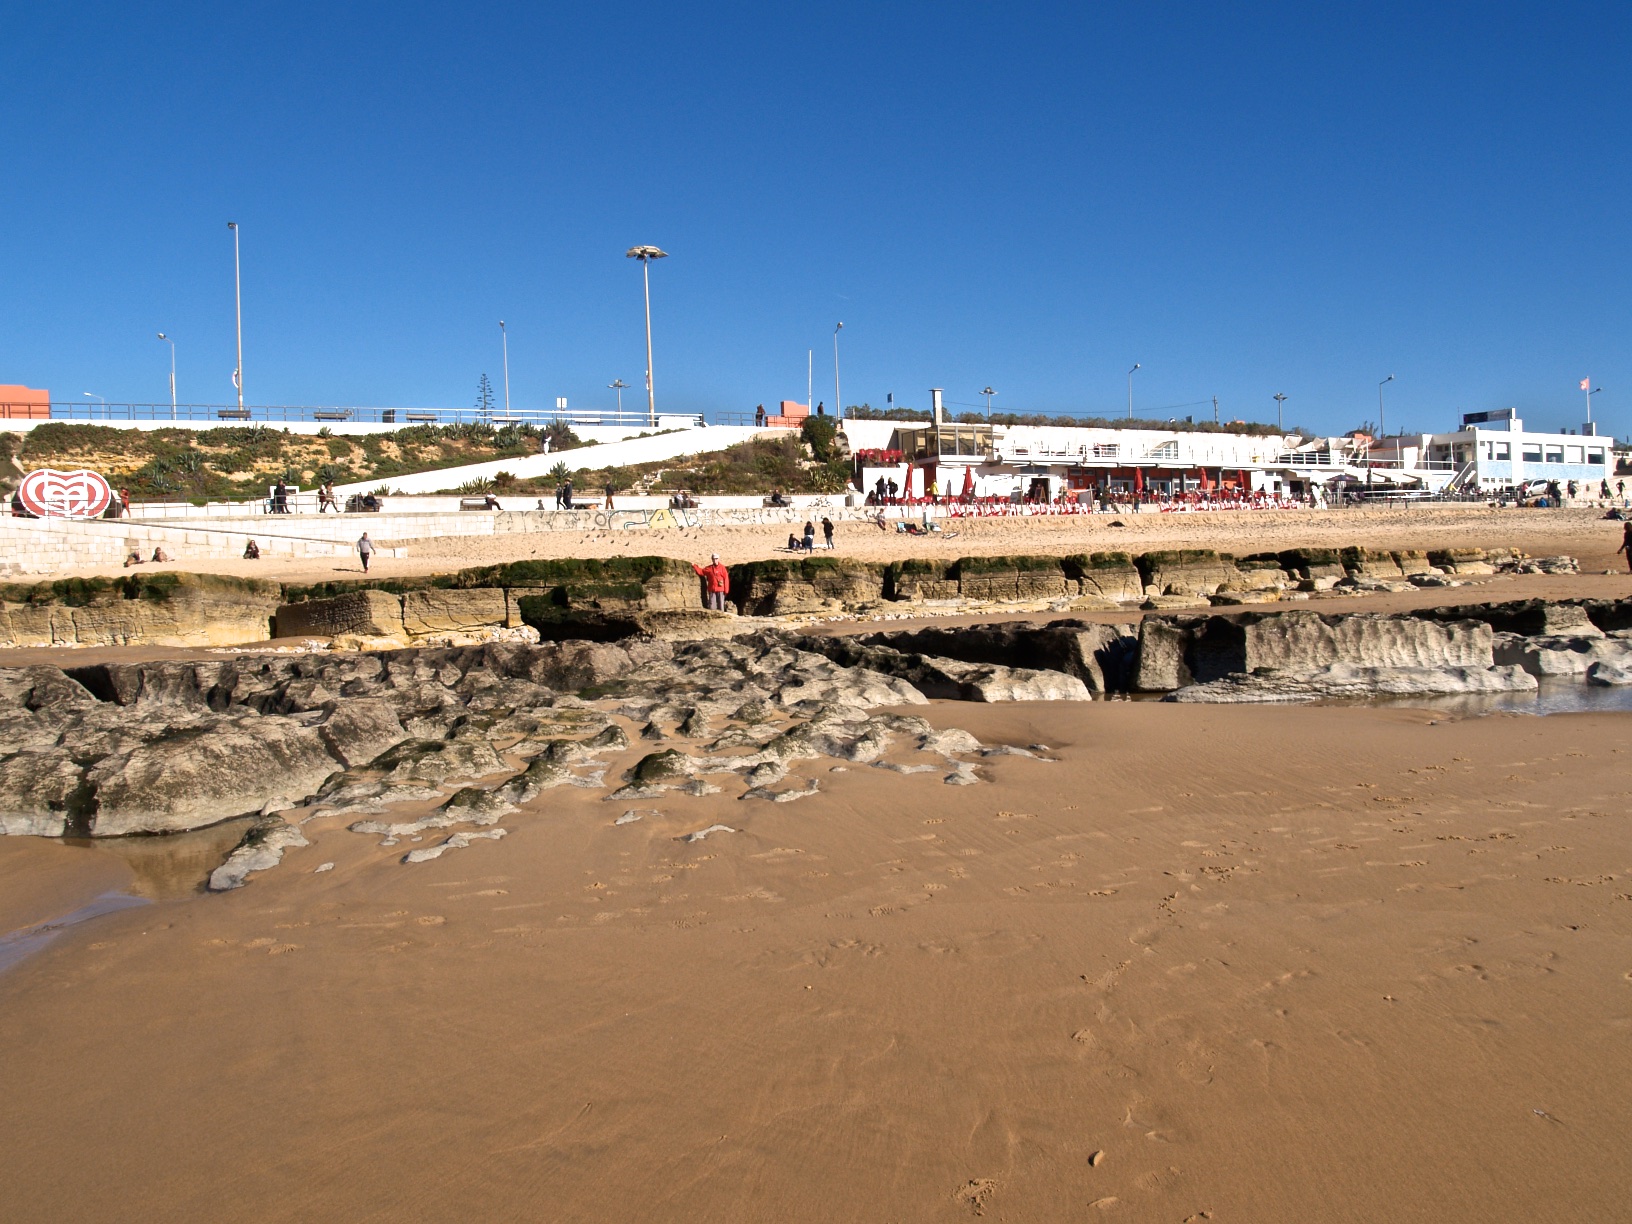
Returning to simpler cases, it may also happen that nature is eventually assisted, like in Jardim da Alagoa (fig. 194) where, much later, after the quarry ceased its work, an imaginative person adapted the almost finished nature’s work into a park for the benefit of the local community.
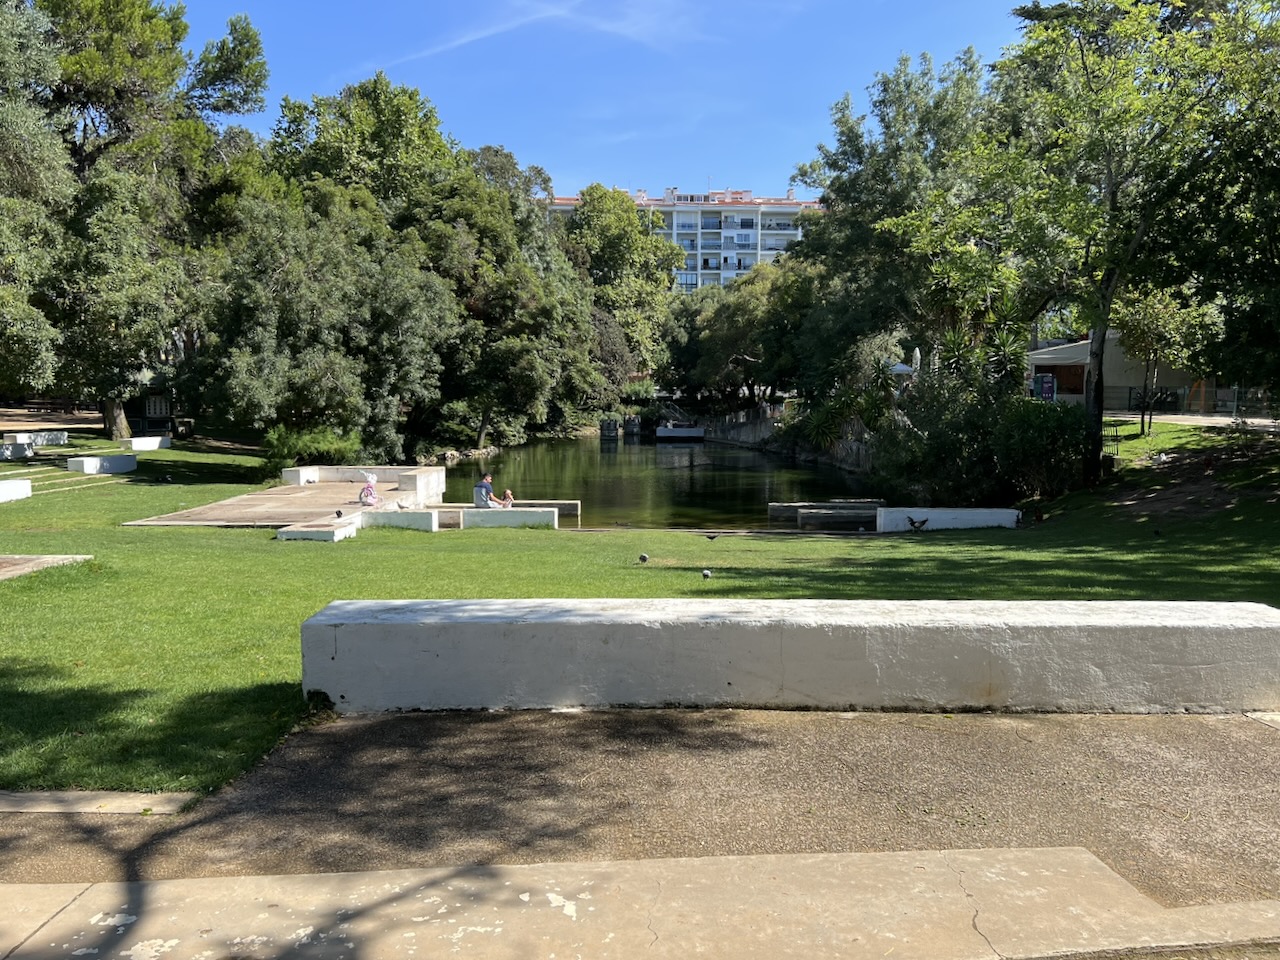
Figure 194 – Old abandoned gravel quarry eventually rehabilitated into a public park (Jardim da Alagoa, Carcavelos, Portugal)
On the other hand, there are numerous other cases where creative people transform sights scarred by quarrying, into wonderful spots, of which I have only been fortunate to visit two, one in South Africa where the quarry was transformed into a water bird sanctuary (fig. 195),
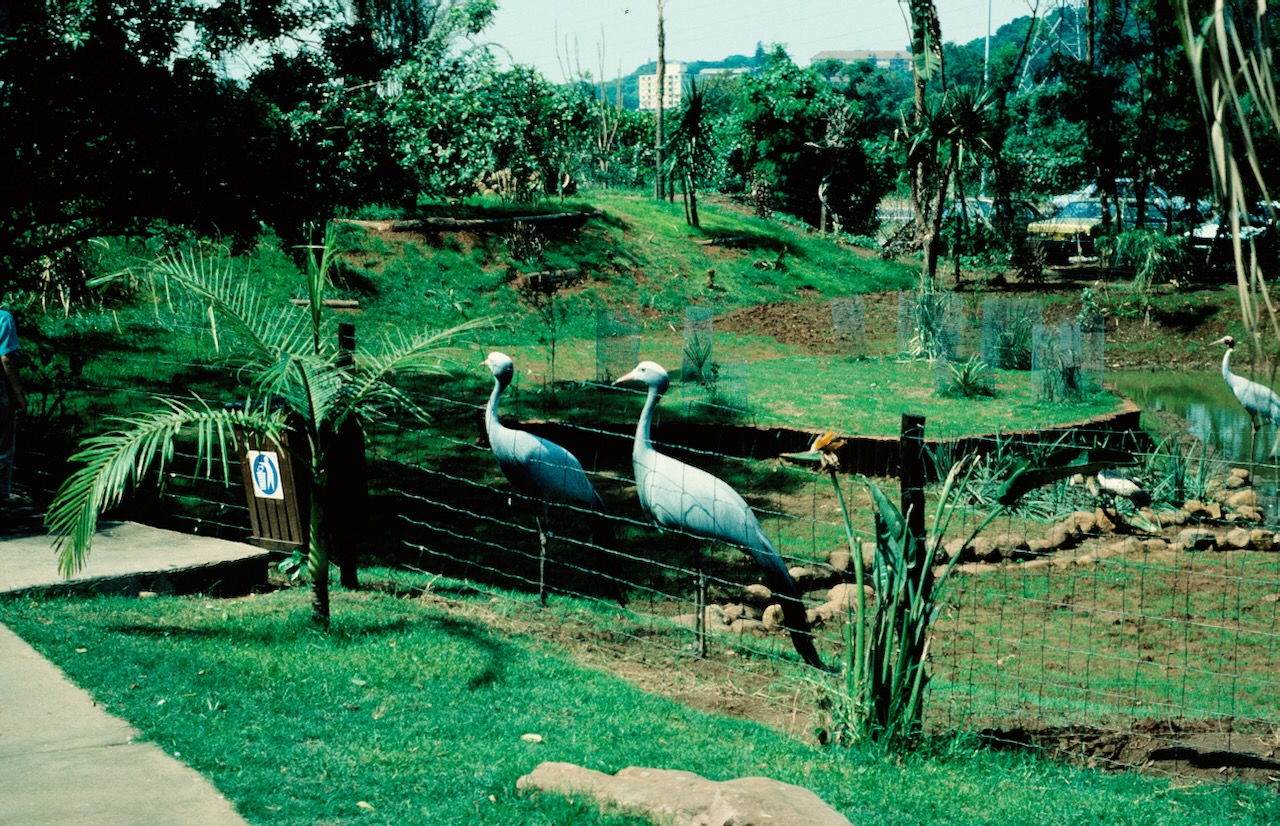
Figure 195 – Old gravel quarry rehabilitated into a bird sanctuary (Umgeni Bird Park, South Africa).
and the other in Cornwall, the Eden Project, my favourite, where the Earth’s main natural biomes are displayed in two plastic domes within a large open garden representing the temperate climate (fig. 196).
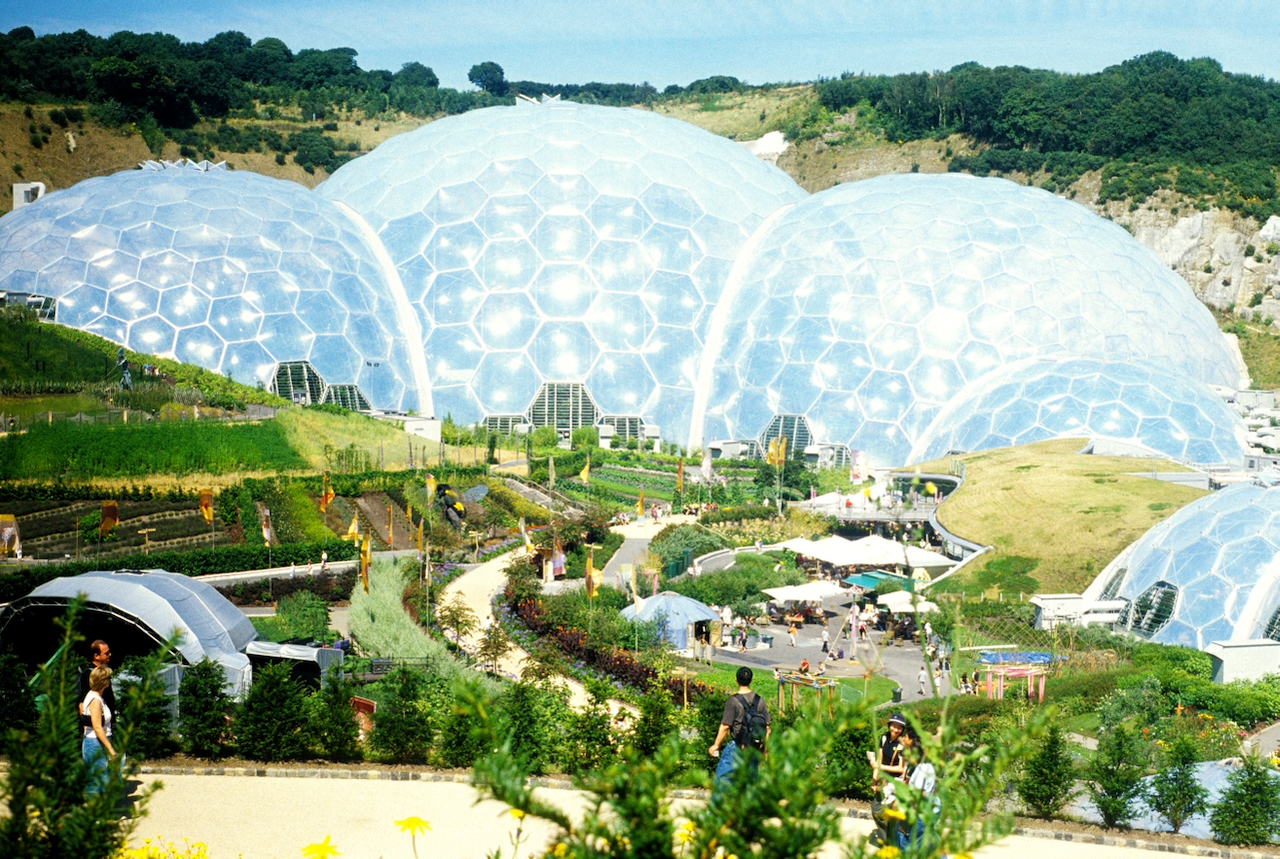
Figure 196 – Old clay pit rehabilitated into an Earth’s Biome exhibit (Cornwall, Great Britain).


 (East Driefontein Mine, Carletonville South Africa)")


